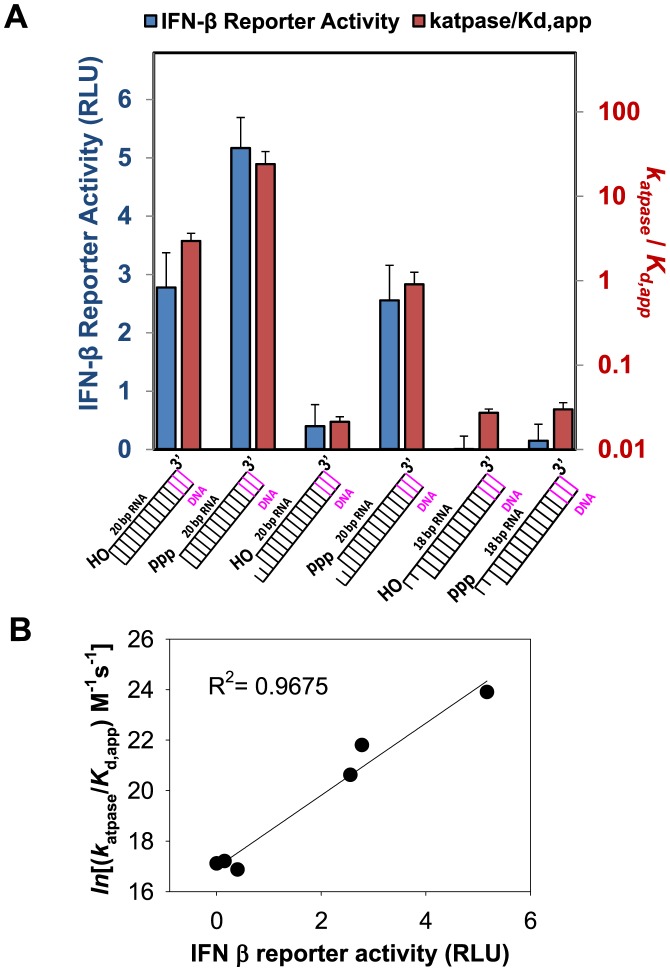
Figure 6.
Signaling Activity of dsRNA with various end-modifications. (A) The katpase/RNA Kd,app of each RNA ligand (blue bars) is plotted alongside their respective IFN-β promoter response elicited in signaling assays (red bars). Error bars are SEM of data collected from quadruplicate sets. (B) Correlation between signaling and logarithm of katpase/Kd of RNAs.

