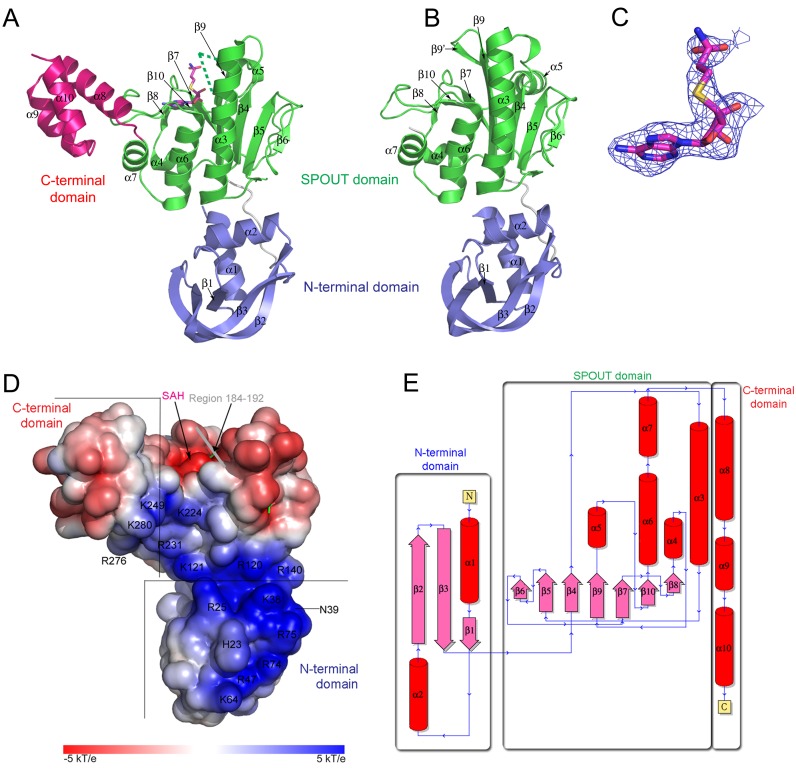
Figure 2.
Crystal structure of SaTrm10_SAH (A) and SaTrm10_1–249 (B), shown in the same orientation (the B molecule of the SaTrm10_SAH crystal structure is shown). In both panels, the domains of SaTrm10 are colour coded as followed: the N-terminal domain in blue, the SPOUT domain in green and the C-terminal domain in pink. In panel A residues 182–194, which are missing in the SaTrm10_SAH model, are indicated by a green dotted line and the reaction product SAH is shown as purple sticks. (C) An Fo-Fc omit map contoured at 2σ of SAH in the SaTrm10_SAH structure. (D) Electrostatic potential mapped on the solvent accessible surface of SaTrm10_SAH. Residues which are part of the positively charged surface are indicated. (E) A topology map of SaTrm10_SAH.

