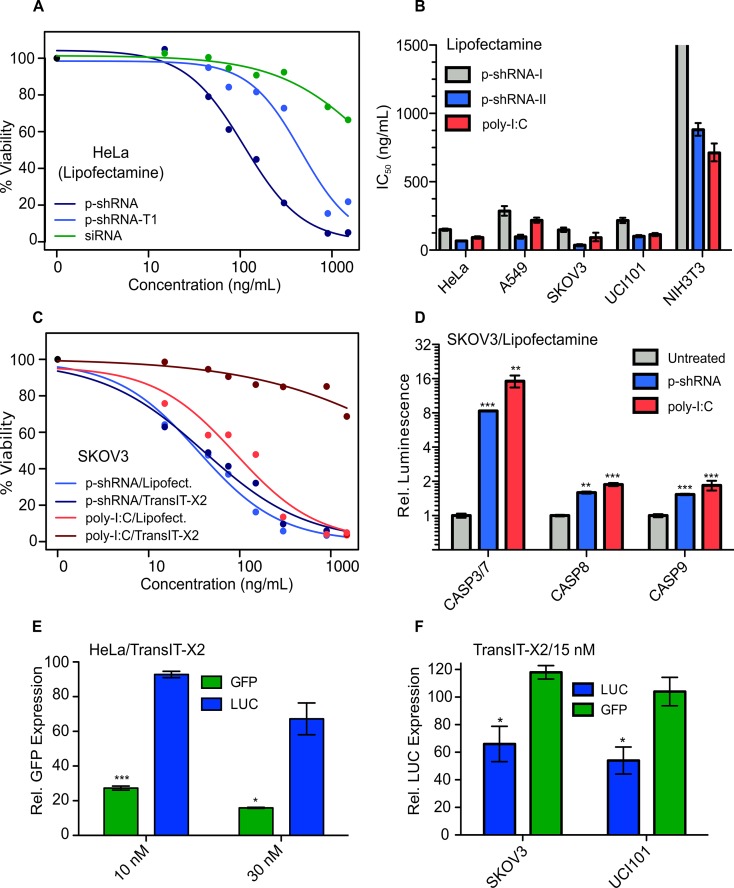
Figure 5.
Cytotoxicity and gene knockdown studies with p-shRNA in different cell lines. (A) Cell viability dose-response curves for p-shRNA, RNase T1-digested p-shRNA and siRNA delivered with Lipofectamine to HeLa cells. Viability was measured by the CellTiterGlo assay and normalized to untreated cells. p-shRNA for this experiment was derived from template 6. (B) IC50 values ± 95% C.I. (based on three parameter log-logistic model) calculated from viability curves for cell lines treated with p-shRNA (I = p-shRNA-21, II = p-shRNA-25; derived from templates 17 and 18) or HMW poly-I:C complexed with Lipofectamine. (C) Cell viability dose-response curves for p-shRNA-25 and poly-I:C delivered with either Lipofectamine or TransIT-X2 to SKOV3 cells. (D) Caspase activation measured using CaspaseGlo luminescence assays 14 h after treating SKOV3 cells with p-shRNA-25- or poly-I:C-Lipofectamine complexes at 300 ng/ml. Values correspond to the means of three biological replicates (±s.e.m.). (E) Mean GFP expression determined by flow cytometry was measured in HeLa cells 72 h following transfection with 10 nM p-shRNA (p-shGFP-21 or p-shLUC-21) complexed with TransIT-X2. Values were derived from mean fluorescence and correspond to the mean of three biological replicates (±s.e.m.) relative to untreated cells. (F) Luciferase expression was measured as bioluminescence normalized to total protein in SKOV3 and UCI101 cells following treatment with 15 nM p-shRNA complexed with TransIT-X2 (p-shLUC and p-shGFP used in this experiment were synthesized from templates 19 and 20). Values are presented as means for three biological replicates (±s.e.m.) relative to untreated cells. For all graphs: P < 0.05 (*), P < 0.01 (**), P < 0.001 (***).

