
Figure 4.
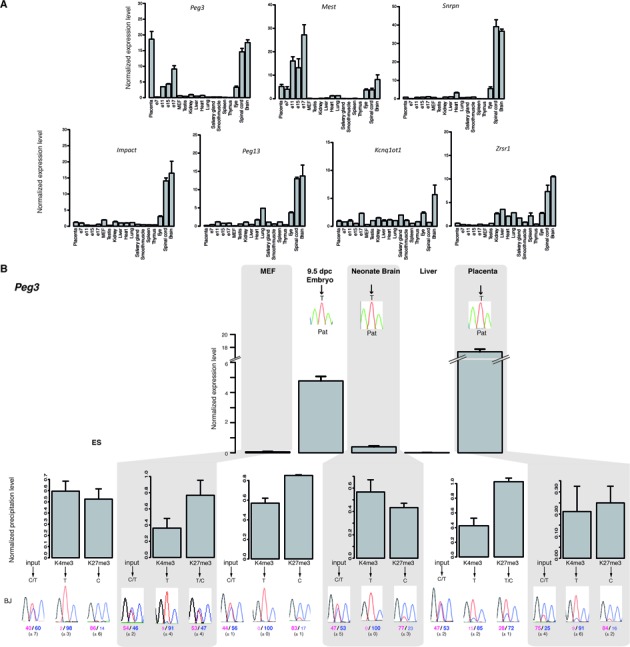
Chromatin bivalency marks mat-ICRs in non-expressing tissues. (A) Microfluidic-based RT-qPCR analysis of the transcripts initiating from the seven mat-ICRs that are not marked by bivalent chromatin in ES cells. Results are presented as fold enrichment of the mean expression level detected in all tissues, after normalization to the geometrical mean of the expression of the three housekeeping genes Arbp, Gapdh and Tbp. Data were obtained from two independent experiments, each analyzed in duplicate. (B) Gene expression and chromatin analysis. Details of the legend are as in Figure 3. The Peg3 ICR is shown as an example of ICR with tissue-specific promoter activity. The allelic distribution of histone marks was determined by direct sequencing of the PCR product encompassing a strain-specific SNP in the analyzed region. Representative data obtained in BJ samples are shown. The mean values (± standard deviation) of the relative allelic ratios (pink: maternal; Blue: paternal) are given. Chromatin bivalency, which is absent in ES cells, is gained in non-expressing tissues through H3K27me3 acquisition on the paternal allele.