
Figure 1.
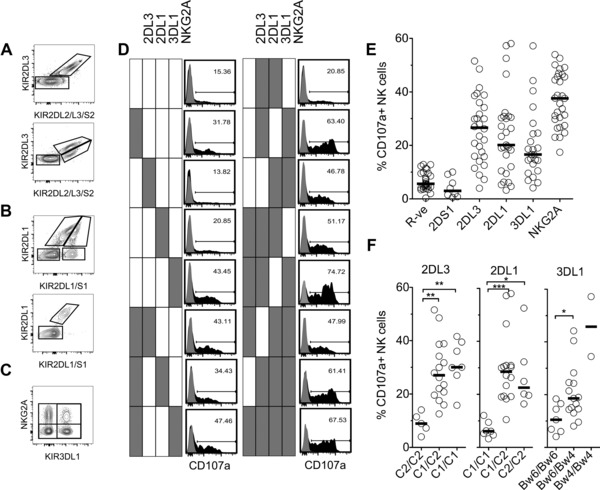
Impact of KIR2DL1 and KIR2DL3 on NKC licensing. (A–C) Representative flow cytometry gating strategy for KIR/NKG2A+ NKC from CD56dim, CD3− lymphocytes in human PBMCs. (A) Identification of KIR2DL3+ and KIR2DL2/S2+ NK cells from a KIR2DL3+/KIR2DL2−/KIR2DS2− genotype donor (top) and a KIR2DL3+/KIR2DL2+/KIR2DS2+ genotype donor (bottom) with combination of 180 701 and DX27 mAbs. KIRDL2/S2+ cells were excluded from analysis as the mAbs do not distinguish KIR2DL2 and KIR2DS2. Data shown are representative of 16/29 (top) and 12/29 (bottom) individuals, respectively. One individual did not carry KIR2DL3. (B) Identification of KIR2DL1+, KIR2DS1+, and KIR2DL1/S1 double‐positive NKC from a KIR2DL1+/KIR2DS1+ genotype donor (top) and a KIR2DL1+/KIR2DS1− genotype donor (bottom) with combination of 143 211 and 11PB6 mAbs. Data shown are representative of 8/29 (top) and 21/29 (bottom) individuals, respectively. (C) Identification of NKG2A+, KIR3DL1+, and NKG2A/KIR3DL1 double‐positive NKC with combination of DX9 and Z199 mAbs. A total of 29/29 individuals are NKG2A+; 24/29 individuals carried 3DL1; two carried 3DL1 high and 3DL1 low alleles. (D) CD107a (H4A3) expression on CD56dim, CD3− NKC subsets following K562 stimulation. PBMCs alone (gray‐filled histograms) or mixed with K562 at 5:1 in triplicate wells (black‐filled histograms, one of three wells are shown). Expression of CD107a on all combinations of KIR2DL1+, KIR2DL3+, KIR3DL1+, and NKG2A+ NKC from a C1/C1, Bw4/Bw6 KIR2DL2/S2‐KIR2DS1 genotype donor. One triplicate is shown. Filled box indicates receptor positive. (E) Degranulation (CD107a) of NKC subsets expressing single receptors or receptor negative (R‐ve) from 29 healthy volunteers each tested once. Mean CD107a expression from triplicate mixes with K562 minus spontaneous CD107a expression from PBMCs alone. (F) Functional response (CD107a) of KIR2DL3 single positive, KIR2DL1 single positive, and KIR3DL1 single positive NKC to stimulation with K562 cells in donors with 0, 1, or 2 cognate HLA‐I allotypes (from left to right for each KIR). (E and F) Each individual (n = 29) was tested once in triplicate degranulation assays with PBMCs alone to quantify spontaneous expression of CD107a. Each circle shown is the mean %CD107a+ minus value from PBMCs alone from a single individual with indicated receptor expression. Black lines represent group medians. Data shown are from 29 independent healthy control individuals. Kruskal–Wallis test with Dunn's multiple comparison test,*p < 0.05; **p < 0.01; ***p < 0.001.