
Fig. 5. Example of the application of metainference in integrative structural biology.
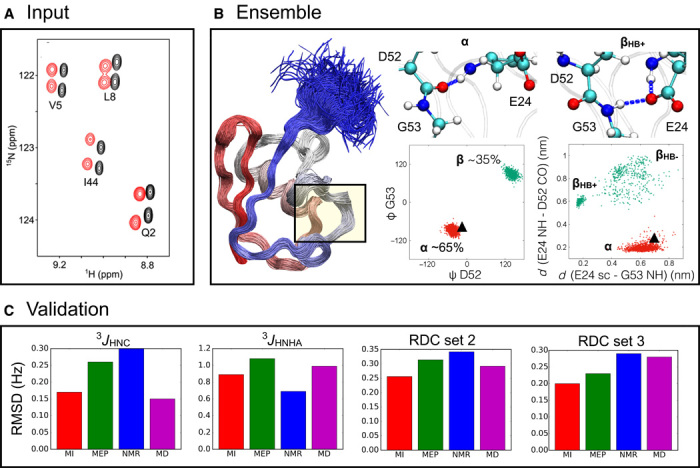
(A) Comparison of the metainference and maximum entropy approaches by modeling the structural fluctuations of the protein ubiquitin in its native state using NMR chemical shifts and RDC data. (B) The metainference ensemble supports the finding (36) that a major source of dynamics involves a flip of the backbone of residues D52-G53 (B; left scatterplot), which interconverts between an α state with a 65% population and a β state with a 35% population. This flip is coupled with the formation of a hydrogen bond between the side chain of E24 and the backbone of G53 (B; right scatterplot); the state in which the hydrogen bond is present (βHB+) is populated 30% of the time, and the state in which the hydrogen bond is absent (βHB−) is populated 5% of the time. By contrast, the NMR structure (Protein Data Bank code 1D3Z) provides a static picture of ubiquitin in this region in which the α state is the only populated one (black triangle). (C) Validation of the metainference (MI; red) and maximum entropy principle (MEP; green) ensembles, along with the NMR structure (blue) and the MD ensemble (purple), by the backcalculation of experimental data not used in the modeling: 3JHNC and 3JHNHA scalar couplings and two independent sets of RDCs (RDC sets 2 and 3).