Figure 3.

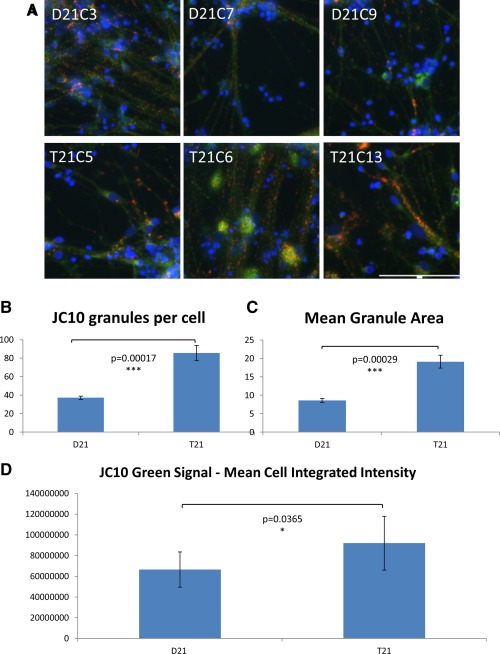
Trisomy 21 results in an increase in size and number of mitochondria in neurons generated from induced pluripotent stem cells (iPSCs). (A): Neurons were generated from iPSCs over a 60‐day differentiation protocol. Live cells were then loaded with JC‐10 to assess mitochondrial membrane potential. Healthy mitochondria are labeled in red, while green cytoplasmic staining indicates that JC‐10 is diffusing out of the mitochondria due to decreased mitochondrial membrane potential. Representative images for each cell line are shown. Image capture and quantification were performed using automated multiparametric analysis on the ImageXpress Micro XL (Molecular Devices) wide‐field high content imaging system, and data were analyzed using MetaMorph software. A total of four wells and a minimum of 1,500 cells per cell line were imaged and analyzed. Scale bar = 100 μm (identical scale for all images). (B): Quantification of the number of mitochondria per cell, and (C) the mean mitochondrial area show that both are increased in T21 neurons compared to the isogenic D21 neurons. (D): Quantification of the integrated intensity for the green signal generated by JC‐10 shows decreased mitochondrial membrane potential in T21 neurons compared to the isogenic D21 neurons. Student's t test, error bars SEM.
