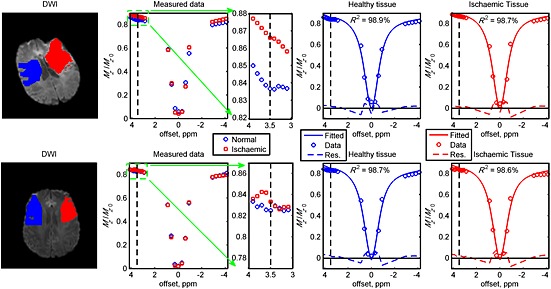
Figure 1.

Measured z‐spectra after B 0 correction and model fits in the different regions of interest of Patients 3 (top row) and 5 (bottom row). The red areas indicate the infarct core [hyperintensity on diffusion‐weighted imaging (DWI) data (b = 1000 s/mm2) acquired during admission] and the blue regions show the contralateral normal‐appearing tissue. Very good fits were obtained in the regions of interest with the coefficient of determinant R 2 ≥ 98.6%. The vertical black dashed lines represent the chemical shift of amide protons and the blue/red dashed lines underneath the fits and measured data are the residuals.
