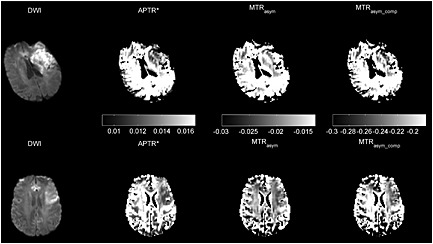
Figure 3.

Diffusion‐weighted imaging (DWI) (b = 1000 s/mm2) and processed amide proton transfer (APT) results (APTR*, MTRasym and MTRasym_comp) from representative patients: top row, Patient 3; bottom row, Patient 5. Tissue masks were used to remove the non‐tissue areas, such as cerebrospinal fluid (CSF); thus, the scale bar does not reflect the quantified APT effect in these areas.
