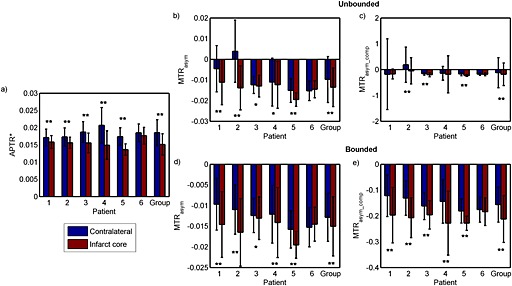
Figure 4.

Results of unpaired t‐tests between the infarct core and contralateral normal‐appearing tissue region of APTR*, MTRasym and MTRasym_comp, where the significant differences are labelled as: *p < 0.05; **p < 0.001. The ‘Group’ label represents the average results of all patients. The bar graphs and error bars refer to the means and standard deviations of each metric, respectively. Bounded results (d and e) include only MTRasym within 0 and −0.05, and MTRasym_comp within −0.5 and 0, whereas the unbounded results (b and c) include all the calculated values.
