
Figure 1.
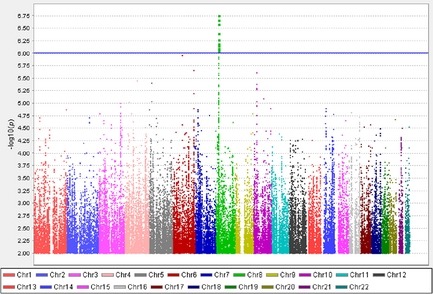
Manhattan plot of the genome‐wide association study on neuropathic pain using imputed single nucleotide polymorphisms. X‐axis represents 22 autosomes. Y‐axis means the −log 10 of p‐values. The blue line is the cut‐off p‐value of 10−6.
Official websites use .gov
A
.gov website belongs to an official
government organization in the United States.
Secure .gov websites use HTTPS
A lock (
) or https:// means you've safely
connected to the .gov website. Share sensitive
information only on official, secure websites.
Manhattan plot of the genome‐wide association study on neuropathic pain using imputed single nucleotide polymorphisms. X‐axis represents 22 autosomes. Y‐axis means the −log 10 of p‐values. The blue line is the cut‐off p‐value of 10−6.