
Figure 2.
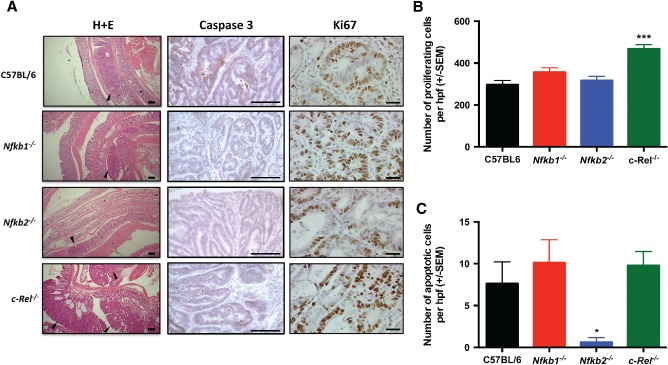
Histology induced by AOM/DSS in C57BL/6, Nfkb1−/−, Nfkb2−/−, and c‐Rel−/− mice. (A) H&E‐, cleaved caspase 3‐, and Ki67‐stained sections from mice following DSS/AOM treatment. Arrowheads highlight adenomas. (B) Mean number of Ki67‐positive cells per hpf within adenomas. (C) Mean number of cleaved caspase 3‐positive cells per hpf within adenomas. Significant differences tested by one‐way ANOVA and Dunnett's test for multiple comparisons. *p < 0.05, ****p < 0.0001 versus WT. Ten mice per group.