
Figure 3.
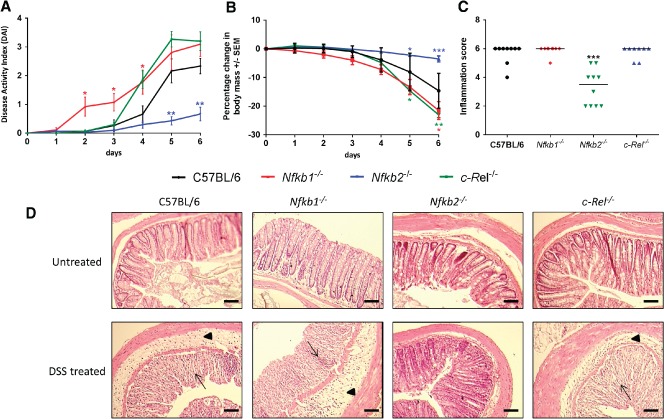
Impact of acute DSS administration on C57BL/6, Nfkb1−/−, Nfkb2−/−, and c‐Rel−/− mice. (A) Clinical disease activity index plotted daily during DSS administration and recovery. Differences tested by Kruskal–Wallis one‐way ANOVA and Dunn's multiple comparison test at each time point. *p < 0.05, **p < 0.01 relative to WT. (B) Percentage change in body weight each day during DSS administration (mean and SEM). (C) Histological inflammation score per mouse; horizontal line at median. Differences tested by one‐way ANOVA and Dunnett's multiple comparison test. *p < 0.05, **p < 0.01, ***p < 0.001 versus WT. (D) Representative H&E‐stained sections of distal colon from mice following 2% DSS treatment (7–10 mice per group). Arrowheads highlight submucosal oedema; arrows highlight almost complete loss of colonic epithelium.