
Figure 5.
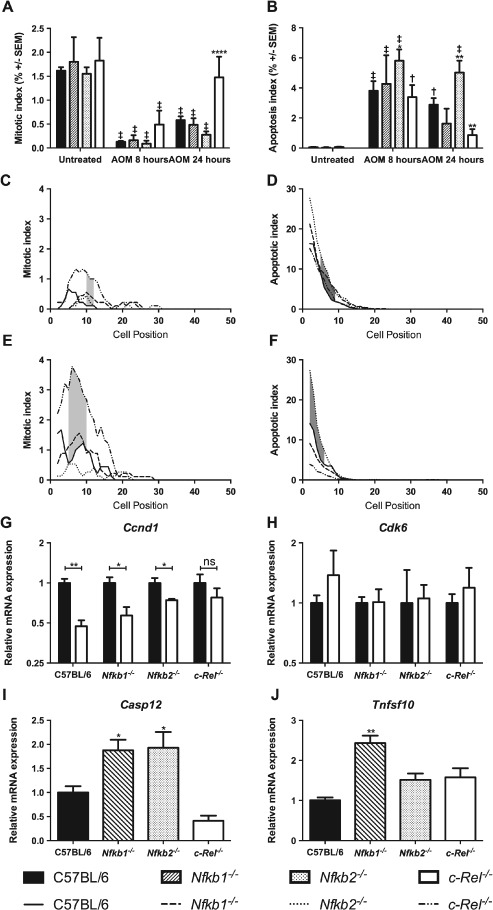
Effect of administration of 10 mg/kg AOM on cell turnover in the distal colon 8 and 24 h after administration in C57BL/6, Nfkb1−/−, Nfkb2−/−, and c‐Rel−/− mice. (A) Mean percentage of cells morphologically mitotic in untreated mice and mice 8 or 24 h following AOM treatment. (B) Mean percentage of cells morphologically apoptotic in untreated mice and mice 8 or 24 h following AOM treatment. Differences were tested by two‐way ANOVA and Dunnett's test for multiple comparisons. * denotes significant difference between AOM‐treated WT and AOM‐treated transgenic mice at the same time point. *p < 0.05, **p < 0.01, ****p < 0.0001. † and ‡ denote significant difference between untreated and AOM‐treated mice of the same genotype. † p < 0.01, ‡ p < 0.0001. All analyses performed on groups of six mice. (C–F) Cell positional plots of mitotic cells (C, E) or apoptotic cells (D, F) 8 h (C, D) or 24 h after treatment with AOM (E, F). Shaded areas identify cell positions where a significant difference in mitotic index was detected between WT and c‐Rel−/− mice (C, E), or in apoptotic index WT and Nfkb2−/− mice (D, F) by modified median test, p < 0.05. (G, H) Relative expression of the indicated mRNAs in colonic mucosa of untreated mice (black bars) and mice 8 h after AOM administration (white bars). Differences tested by two‐way ANOVA and Dunnett's test for multiple comparisons; *p < 0.005, **p < 0.001 versus untreated mice of the same genotype. ns = not significant. (I, J) Relative expression of the indicated mRNAs in colonic mucosa 8 h after AOM administration. Significant differences in linearized expression values tested in n = 4 mice by one‐way ANOVA and Dunnett's test for multiple comparisons. *p < 0.005, **p < 0.001 versus WT.