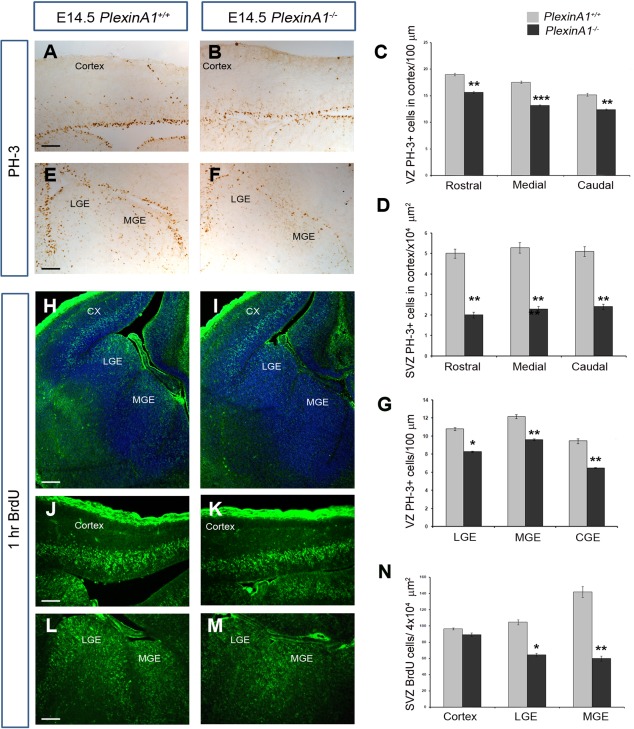
Figure 4.

Reduced proliferation in PlexinA1−/− mice. Coronal brain sections from PlexinA1+/+ (A,E,H,J,L) and PlexinA1−/− (B,F,I,K,M) mice at E14.5 were immunostained for PH‐3 (A,B,E,F) and BrdU (H–M). Quantification of PH‐3+ (C,D,G) and BrdU+ (N) cells in the proliferative zones of PlexinA1−/− animals showed reduced numbers compared with PlexinA1+/+ littermates. Error bars indicate SEM (*P < 0.01, **P < 0.001, ***P < 0.0001). Cx, cortex; CGE, caudal ganglionic eminence; MGE, medial ganglionic eminence; LGE, lateral ganglionic eminence. Scale bars = 50 µm in A (applies to A,B); 150 µm in E (applies to E,F); 150 µm in H (applies to H,I); 50 µm in J (applies to J,K); 150 µm in L (applies to L,M).
