
Fig. 2. Activity measures of juvenile white storks.
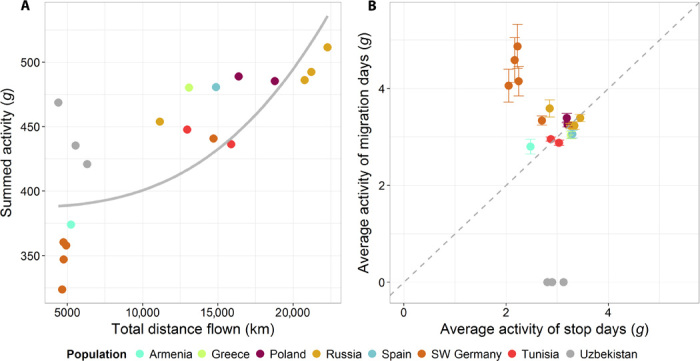
(A) Summed activity (ODBA) of the first 5 months of a juvenile’s life as a function of total distance flown during the same time. The solid gray line represents the third-order polynomial regression. The best-fitting regression is provided by the equation Y = 387.2 + 1.344 × 10−11 X3. (B) Average activity (ODBA) of a migration day in relation to average activity of a stopover day. Color represents the different populations. Gray dashed line is a reference line.