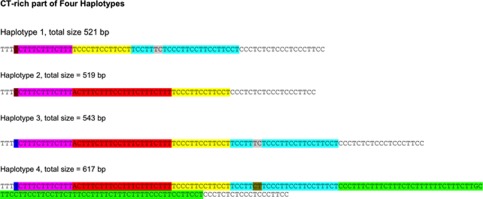
Figure 2.

Observed haplotypes of the CT‐rich region. The portion of the sequences shown corresponds to chr4:90,742,421‐90,742,492 (GRCh37/hg19) on the minus strand. Identical sequences shared among the haplotypes are color coded. Reprinted from ref. 10.
