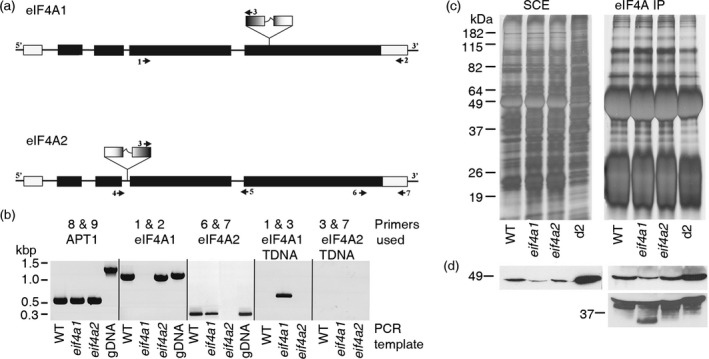
Figure 1.

Identification of eIF4A insertion mutants.
(a) Schematic representation of insertional mutation in EIF4A1 and EIF4A2 genes. Primers used for genotyping (Table S1) are indicated by numbered arrowheads.
(b) Transcript analysis of eIF4A expression in wild‐type (WT) and mutant strains. RT‐PCRs using cDNA from Arabidopsis Columbia‐0 WT controls and the eif4a1 and eif4a2 T‐DNA insertion mutants. The APT1 loading control used primers spanning five introns of the APT1 gene, confirming that cDNA samples were free of contaminating genomic DNA and equally loaded. The EIF4A1 transcript is not detectable in the eif4a1 sample using primers spanning the T‐DNA insertion site, but it is present in the WT and eif4a2 mutant. In genomic DNA there is a small intron present, and hence the EIF4A1 gDNA PCR product is slightly larger compared with that of the cDNA products. Likewise, the EIF4A2 transcript is not detected in the eif4a2 sample (EIF4A2), but is in the eif4a1 sample. A partial EIF4A1 transcript from the third exon to the T‐DNA insertion site is detected in the eif4a1 sample (EIF4A1 T‐DNA), suggesting the possibility that a truncated eIF4A‐1 protein could be translated.
(c, d) Analysis of eIF4A‐1 protein levels in WT and mutant plants.
(c) Silver‐stained SDS‐PAGE gels of soluble cell protein extracts (SCE) and anti‐wheat eIF4A immunoprecipitations (eIF4A IP) from Columbia‐0 (WT), eif4a1 and eif4a2 plants, and a 2‐day‐old Arabidopsis cell culture (d2) as an internal control. The band intensities indicate similar protein loadings for all plant samples. Duplicate gels were immunoblotted with the anti‐wheat eIF4A antibody (d).
(d) Western‐blot analysis of eIF4A levels in mutant and WT plants. The total level of eIF4A (SCE) was reduced in the eif4a1 samples compared with the Col‐0 control, the eif4a2 levels appeared similar to Col‐0. This was reflected in the IP experiment (eIF4A IP upper panel), less eIF4A protein was affinity purified from the eif4a1 samples, whereas that from the eif4a2 samples is similar to Col‐0. In a duplicate experiment (panel below) where more protein was loaded per lane, a smaller band was present only in the eif4a1 sample.
