Figure 6.

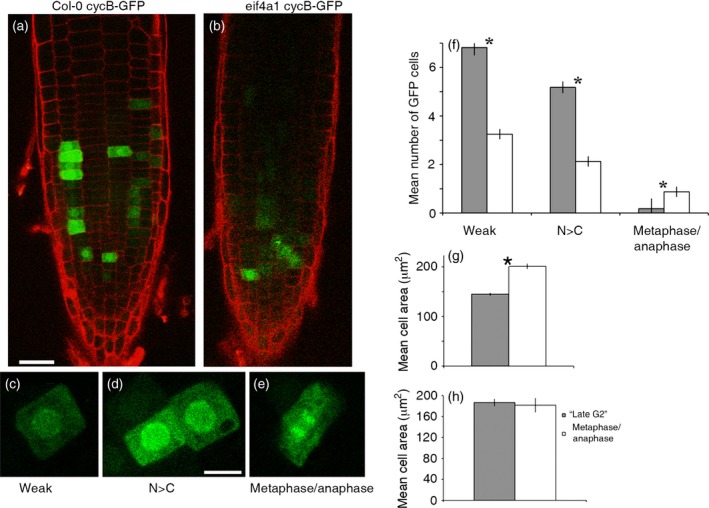
Confocal scanning microscope images of root tips expressing a cyclin B1‐1::GFP reporter.
(a) Col‐0 and (b) eif4a1 roots.
(c–e) Cells expressing different patterns of cyclin B1‐1::GFP as they progress through mitosis; N > C indicates stronger nuclear labelling compared with the cytoplasm; metaphase/anaphase includes cells where the chromatin is stained and aligned on the metaphase plate or has separated.
(f) Histograms showing the mean numbers of cyclin B::GFP‐positive root tip cells labelled according to this classification in Col‐0 (grey bars) and eif4a1 (white bars) backgrounds.
(g) Mean cell areas of cyclin B::GFP‐expressing cells from Col‐0 (grey bars) and eif4a1 (white bars) mutant roots.
(h) Mean areas of ‘late G2’ cells (grey bars) and ‘metaphase/anaphase’ cells (white bars) in eif4a1 roots expressing cyclin B::GFP. Asterisks in (f–h) indicate significant differences according to Student's t‐tests. Scale bars: (a) 30 μm, also applies to (b); (c–e) 10 μm.
