Figure 7.

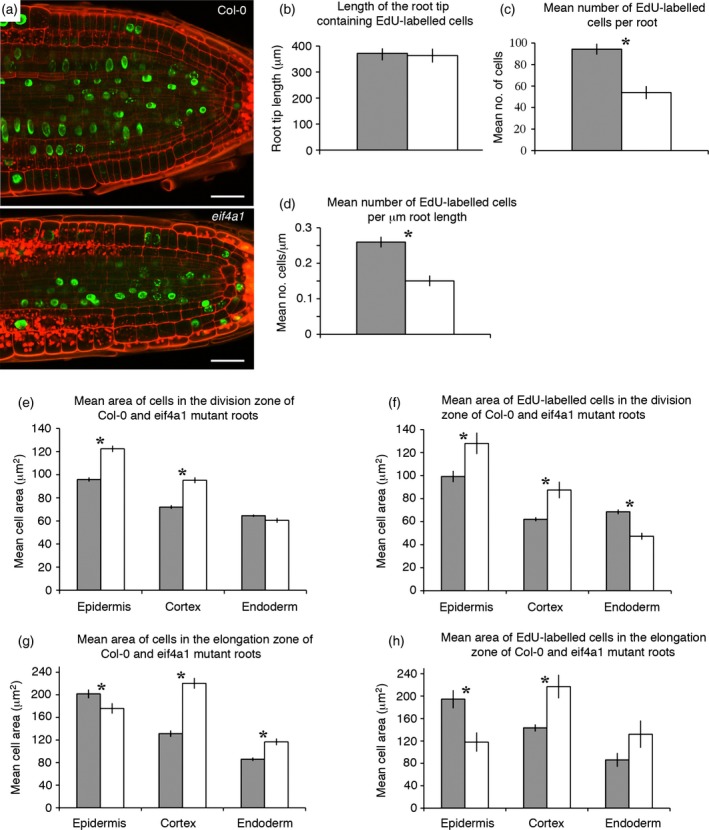
Image analysis data from EdU‐Schiff propidium iodide‐stained and cyclin B::GFP‐expressing roots.
(a) Confocal scanning microscope images through the quiescent centre and division zone of EdU‐Schiff propidium iodide‐labelled roots of Col‐0 and eif4a1 mutants.
(b–h) Histograms comparing various parameters of Col‐0 (grey bars) and eif4a1 (white bars) mutant roots labelled with EdU and Schiff propidium iodide. Asterisks in (c–h) indicate significant differences as shown by Student's t tests.
