Figure 4.

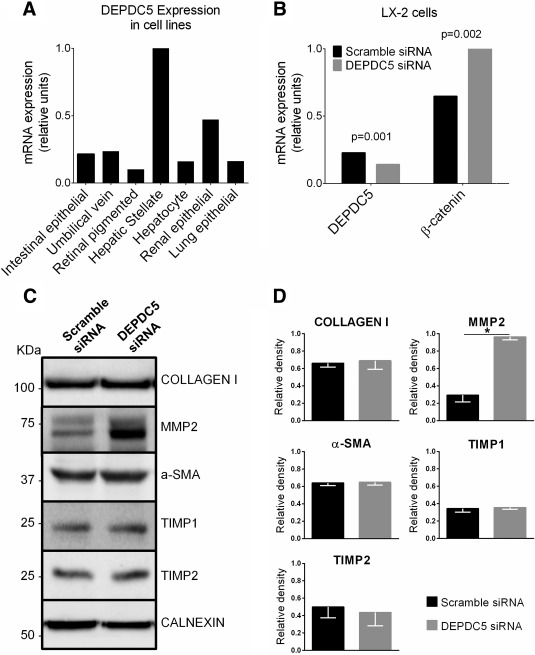
DEPDC5 is highly expressed in LX‐2 cells and DEPDC5 silencing induces β‐catenin levels and MMP2 production in LX‐2 cells. (A) DEPDC5 mRNA expression in human tissues assessed by quantitative PCR. The tissue with the highest Ct value was assigned a value of 1. (B) β‐catenin and DEPDC5 mRNA expression in LX‐2 cells incubated with negative control (scramble) siRNA or DEPDC5 siRNA for 48 hours. The experiments were repeated four times. DEPDC5 reduction (P = 0.001) and β‐catenin increase (P = 0.002) were significant. (C) Lysate fractions of LX‐2 cells transfected with scramble siRNA or DEPDC5 siRNA for 48 hours analyzed by western blotting. Calnexin was used as loading control. (D) Quantified relative protein levels are shown as column charts. The data are the means ± standard deviation of four independent experiments (P < 0.05).
