
Figure 5.
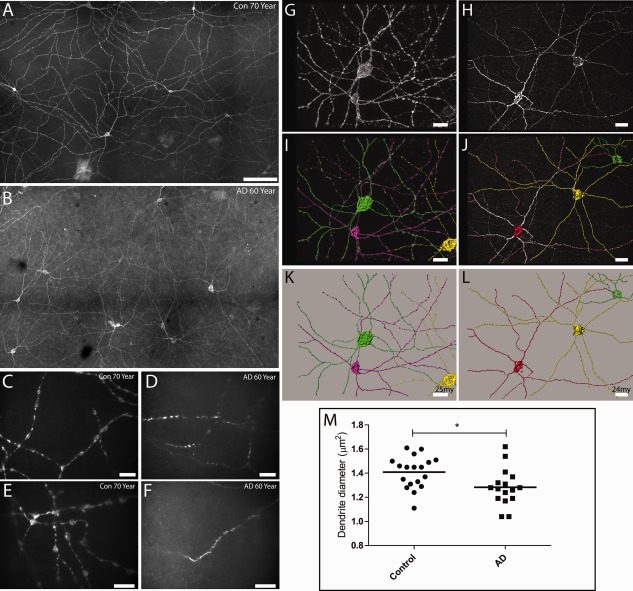
Flat‐mounted retinas and dendritic process analysis in Alzheimer disease (AD) patients and controls (Con). (A–F) Melanopsin immunoreactivity in control retinas (A, C, E) and in AD patients (B, D, F). At low magnification, melanopsin staining is present in a subpopulation of ganglion cells and displaced ganglion cells forming a dendritic network. The dendritic network of melanopsin processes in control retinas is characterized by long processes with a large “boutons en passant” (A, C, E). In contrast, melanopsin retinal ganglion cells (mRGCs) in AD patients have an abnormal morphology in which dendritic processes have a smaller diameter with a lack of “boutons en passant” (B, D, F). (G–L) Morphological analysis of control (G, I, K) and AD mRGCs (H, J, L). Stacks of images of mRGCs were generated, and a 3‐dimensional reconstruction was performed (see Subjects and Methods), followed by analysis of the processes using the filament trace module in Imaris (Bitplane). In G, I, and K, 3 cells from a control (green, purple, and yellow) and their dendritic processes are visualized. (G) The raw picture after deconvolution and (I) after tracing of the processes are shown. (K) Only the traced cells identified by the program are shown. Similarly, in H, J, and L, 3 mRGCs from AD an patient are shown. (M) The results of the total analysis of 18 cells from 3 controls (C3: 60 years old, 6 cells; C5: 70 years old, 8 cells; C12: 95 years old, 4 cells) and 16 cells from 4 AD patients (A1: 51 years old, 5 cells; A2: 62 years old, 5 cells; A6: 80 years old, 3 cells; A13: 96 years old, 3 cells) are shown, demonstrating a significant reduction of dendrite diameter in AD patients (*p = 0.003). Scale bars: A, B, 100 µm; C, D, 50 µm; E, F, 20 µm; G, I, K, 25 µm; H, J, L, 24 µm.