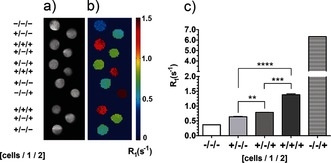
Figure 2.

MR imaging of cell‐surface glycosylation in vitro. a) T 2‐weighted images and b) corresponding maps of the R 1 relaxation rates (1/T 1). The images were obtained from cell pellets of untreated cells (+/−/−), cells treated with solvent vehicle and 2 (1.0 mm, for 45 min at 37 °C; +/−/+), or cells incubated with 1 (50 μm, for 24 h at 37 °C) and 2 (1.0 mm, for 45 min at 37 °C; +/+/+). The R 1 rates were also measured in the buffer in which the cells had been suspended (−/−/−) and in a buffer to which 2 had been added (1.0 mm; −/−/+). Data represent the mean±standard error of the mean (SEM) (n=3). **P<0.01, ***P<0.005, ****P<0.001. Two‐tailed unpaired T‐test with Mann–Whitney correction.
