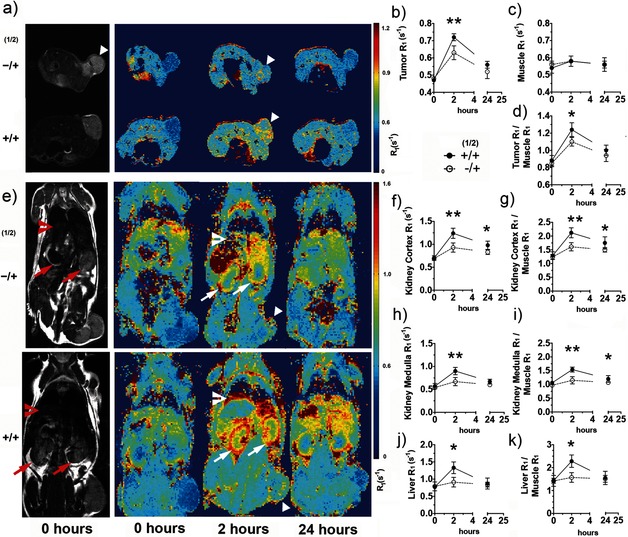
Figure 4.

Imaging tissue glycosylation in vivo using MRI T 1 maps. T 2‐weighted (gray scale) images (a, e) and T 1 maps (pseudo‐colored; a, e) of representative mice injected with the vehicle and 2 (−/+) or 1 and 2 (+/+), showing metabolic labeling of tumor (triangles), kidney (arrows), and liver (chevrons), 2 and 24 h after injection of 2. a) Axial and e) coronal images are shown. The kinetics of N‐Ac4GalNAz dependent contrast formation were analyzed for regions of interest defined on the T 2‐weighted images for the tumor (b), muscle (c), kidney cortex (f), medulla (h), and liver (j), and the corresponding data were normalized to the muscle data (d, g, i, k). Data in (b)–(d) and (f)–(k) represent mean±SEM (n=5). The relaxation rate R 1 (1/T 1) is expressed in s−1. *P<0.05, **P<0.01. Two‐tailed unpaired T‐test with Mann–Whitney correction.
