Figure 5.

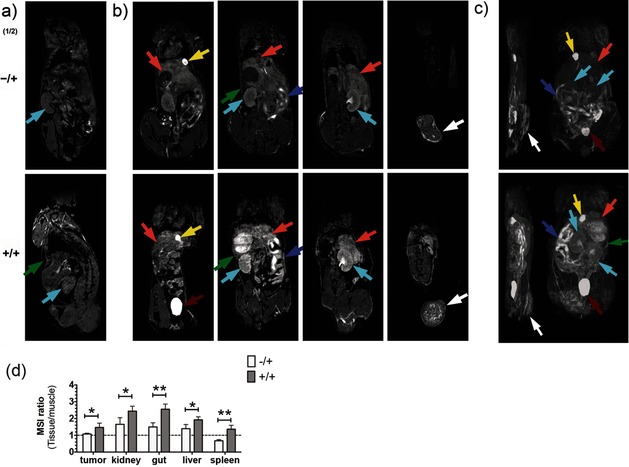
Imaging tissue glycosylation in vivo using T 1‐weighted MRI. Coronal T 1‐weighted images, before (a) and 2 h after (b) the injection of 2. Maximum intensity projection of T 1‐weighted signals (c) from representative mice injected with solvent vehicle and 2 (−/+) or 1 and 2 (+/+). Coronal T 1‐weighted images (b, left to right) are displayed from the ventral towards the dorsal side. Maximum intensity projections (c) onto the sagittal (left) and coronal (right) planes. b) Metabolic labeling was observed in the tumor (white arrows), kidney (cyan), liver (orange), gut (purple), and spleen (green) 2 h after the injection of 2. Bladder and gallbladder are indicated by red and yellow arrows, respectively. d) The N‐Ac4GalNAz dependent contrast was analyzed semi‐quantitatively, using regions of interest defined in the T 1‐weighted images for the tumor, kidney, gut, liver, and spleen; the mean signal intensity (MSI) for these tissues was divided by the MSI of muscle. Data represent mean±SEM (n=4). *P<0.05, **P<0.005. Two‐tailed unpaired T‐test with Mann–Whitney correction.
