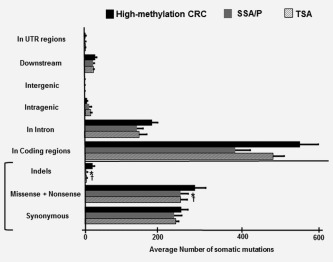
Figure 4.

Average number of somatic mutations. The frequency of somatic mutations in high‐methylation CRC was significantly higher than those in SSA/P and TSA, both for nonsynonymous mutations (p < 0.0001 and p = 0.001, respectively) and indels (p < 0.0001 and p < 0.0001, respectively). *p < 0.05 between high‐methylation CRC and SSA/P (Student's t‐test). †p < 0.05 for comparison of high‐methylation CRC and TSA (Student's t‐test).
