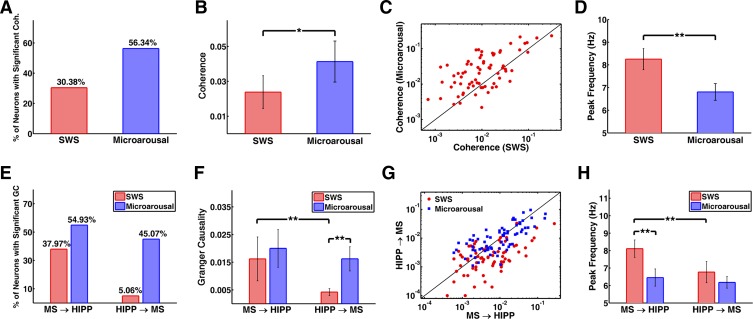
Fig. 4.
Coherence and GC of MS unit and HIPP LFP activity. A–D: comparison of MS-HIPP coherence in SWS and microarousals. A: % of neurons with significant coherence. B: group averages of coherence. C: coherence of individual neurons. D: group averages of peak frequency of coherence in different states. E–H: comparison of MS→HIPP and HIPP→MS GC in SWS and microarousal. E: % of neurons with significant GC. F: group averages of GC. G: GC of individual neurons. H: group averages of peak frequency of GC in different states. Significance: *P < 0.05, **P < 0.005.

