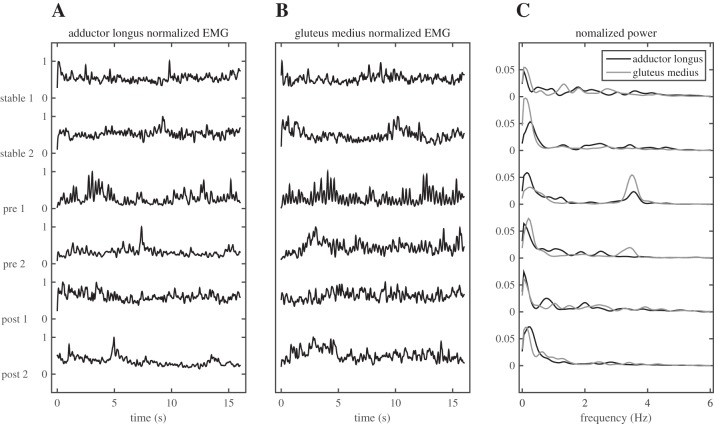
Fig. 4.
Typical example of EMG data in trials without sensory manipulations, showing the linear envelopes normalized to their maximum values (A and B) and the power spectra of the linear envelopes (C) for all trials without sensory manipulations. Note the strong increase in muscle activity in the 1st pretraining trial or the unstable surface and the peaks in power at ∼3.5 Hz in the pretraining trials on the unstable surface.

