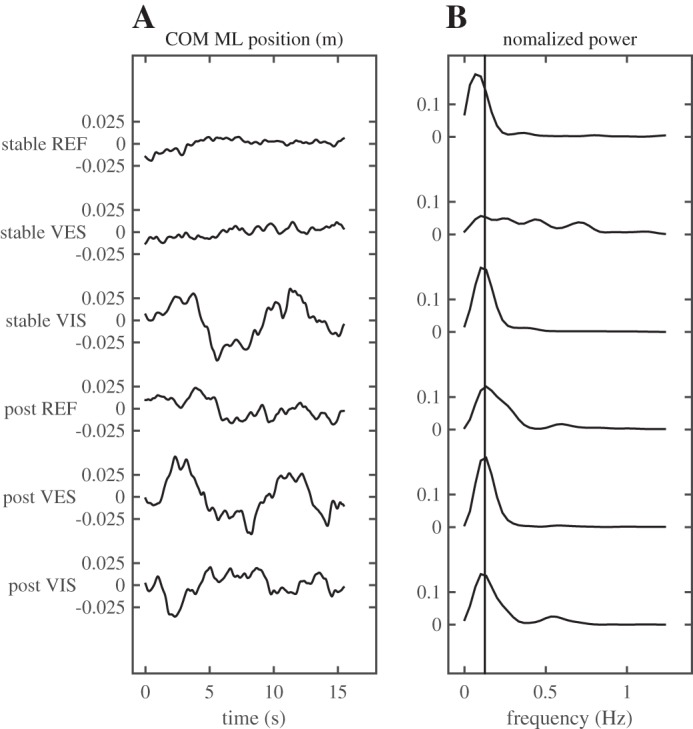
Fig. 9.

Typical example of the times series of the ML position of the COM (A) and its normalized power spectrum (B), comparing trials with and without sensory manipulations. The last three trials on the rigid and on the unstable surface are plotted here. Note the increase in COM excursion and the peaks in the power spectra at the 0.125 Hz frequency in trials with sensory manipulations. REF, reference; VES, vestibular manipulation (galvanic vestibular stimulation); VIS, visual manipulation (moving scenery).
