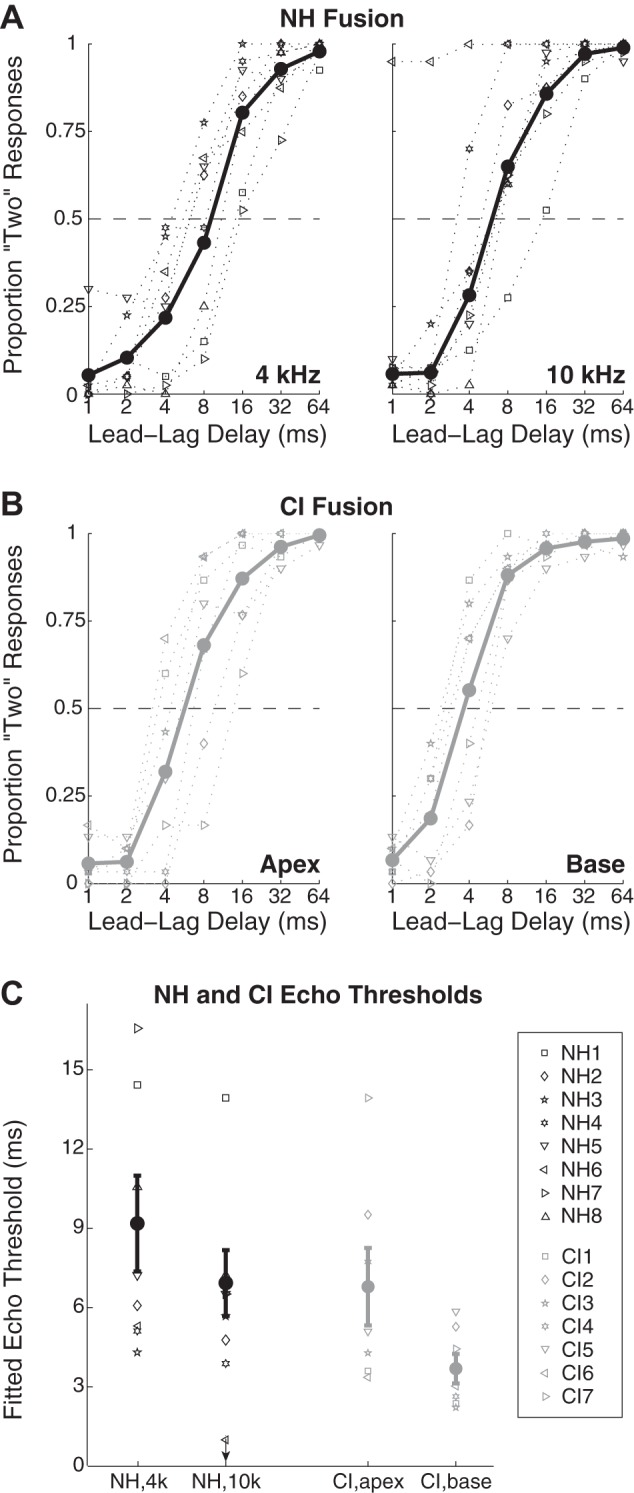
Fig. 2.

Bilateral CI and NH subjects experience comparable lead-lag fusion. A: proportion of “two locations” responses among NH subjects for 4 kHz (left) and 10 kHz (right) as a function of lead-lag delay. Symbols and dotted lines give data for individual subjects (see key in C); bold points and lines give mean data across subjects, excluding subject NH6, whose performance diverged from the group in the 10 kHz condition (see text). B: data, as in A, for CI subjects in “apical” (left) and “basal” (right) conditions. C: echo thresholds across conditions and groups, computed as the lead-lag delay giving 50% “two locations” responses via a logistic fitting procedure (see materials and methods).
