Fig. 3.
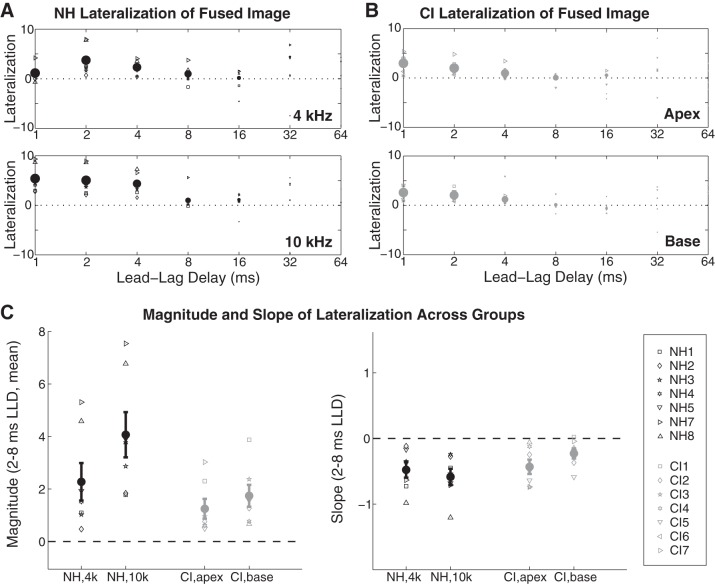
Bilateral CI and NH subjects experience comparable localization dominance. A: lateralization data are given as magnitudes of lateralization for trials on which subjects reported “one location”; data are combined across left-leading and right-leading trials. Positive values indicate lateralization in agreement with the sidedness of the lead; negative values indicate lateralization in agreement with the sidedness of the lag. The size of individual subject (symbols) and mean (bold circles) data points is proportional to the number of responses recorded at each lead-lag delay (see text). Reduced lateralization at 1 ms lead-lag delay in the NH 4-kHz condition despite strong fusion is ostensibly due to the spurious lag-favoring interaural level difference (see text). B: lateralization data for CI subjects; symbols as in A. C: magnitude (left) and slope (right) of lateralization for CI and NH subjects were computed for values of 2-, 4-, and 8-ms lead-lag delay (LLD) (see text). While the overall magnitude of lateralization was somewhat greater among NH subjects (suggestive of greater ITD sensitivity), the pattern of lateralization across LLD was similar between NH and CI groups. Error bars show ±1 SE.

