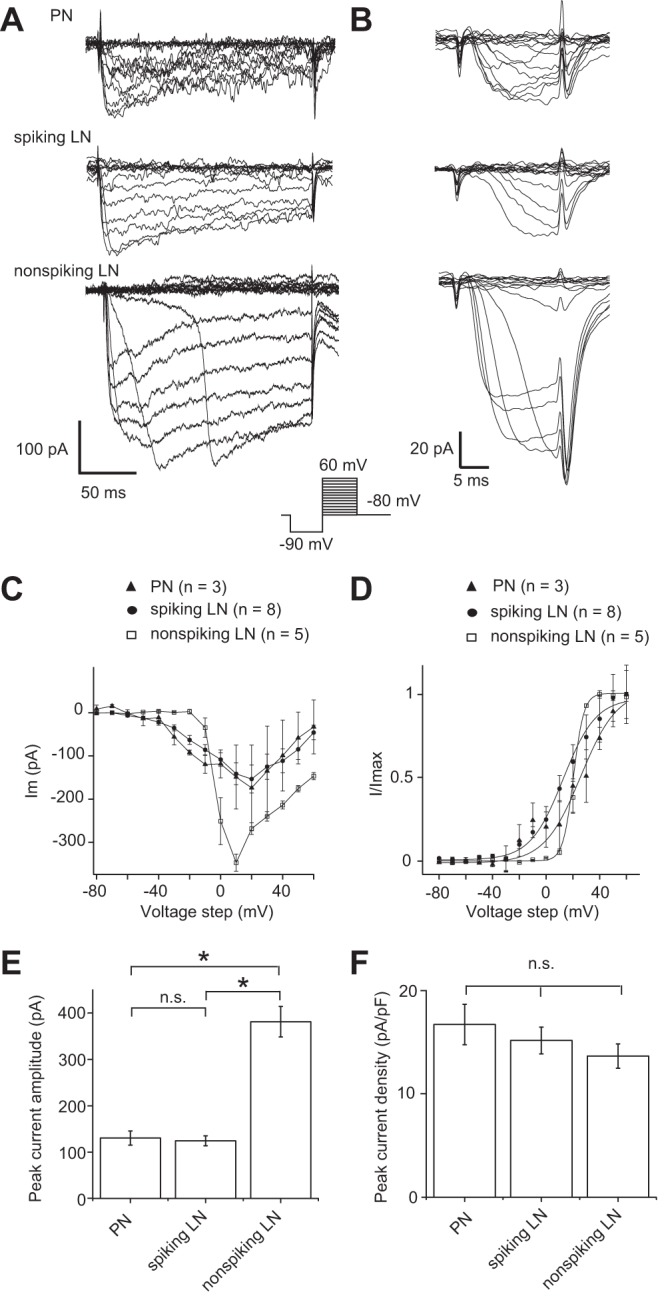
Fig. 4.

Comparison of Ca2+ currents (ICa) in individual AL neurons in whole cell voltage-clamp configuration. A: current traces showing voltage-dependent activation of ICa, measured during the step depolarization in cells loaded with a CsCl patch pipette internal solution and bathed in a solution containing 10−7 M TTX, 5 × 10⁻³ M 4-AP, and 2 × 10⁻² M TEA. B: current traces showing tail ICa, measured during the step depolarization in cells loaded with a CsCl patch pipette internal solution and bathed in a solution containing 10−7 M TTX, 5 × 10⁻³ M 4-AP, and 2 × 10⁻² M TEA. C: I-V relationship of ICa. D: I-V relationship of tail ICa. The curves in C and D were fit to a first-order Boltzmann equation. E: comparison of absolute maximum current amplitude of ICa. F: comparison of peak current density of ICa. *P < 0.05.
