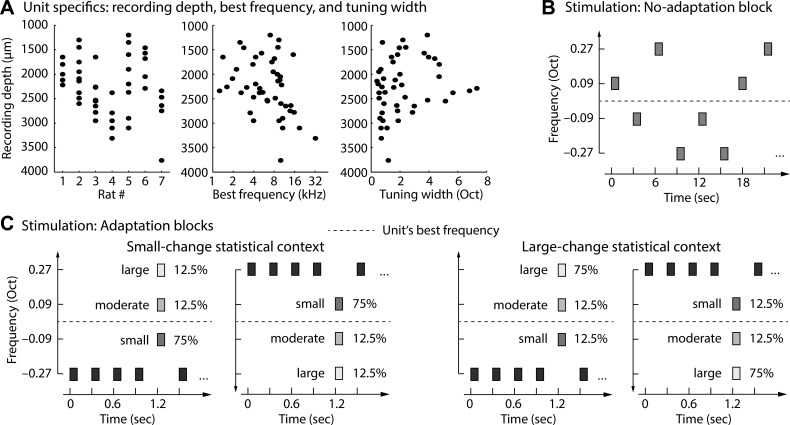
Fig. 1.
Description of units and experimental stimulation. A: recording depth, best frequency, and tuning width for each unit. Note that the graph does not provide information about the number of electrode penetrations within an animal. Dots may be the result of >1 penetration/track. B: a “no-adaptation” block consisted of random presentation of tones that could take on 1 of 4 frequencies. The onset-to-onset interval was 3 s. Responses to these tones were considered to reflect the maximal response amplitude when the neuron is in a nonadapted state. C: stimulus presentation in “adaptation” blocks comprised 2 statistical contexts. In the small-change statistical context the small deviant was presented with highest probability (relative to all deviants), while in the large-change statistical context the large deviant was presented with highest probability (relative to all deviants). Tones in the “adaptation” blocks were presented with an onset-to-onset interval of 0.3 s.

