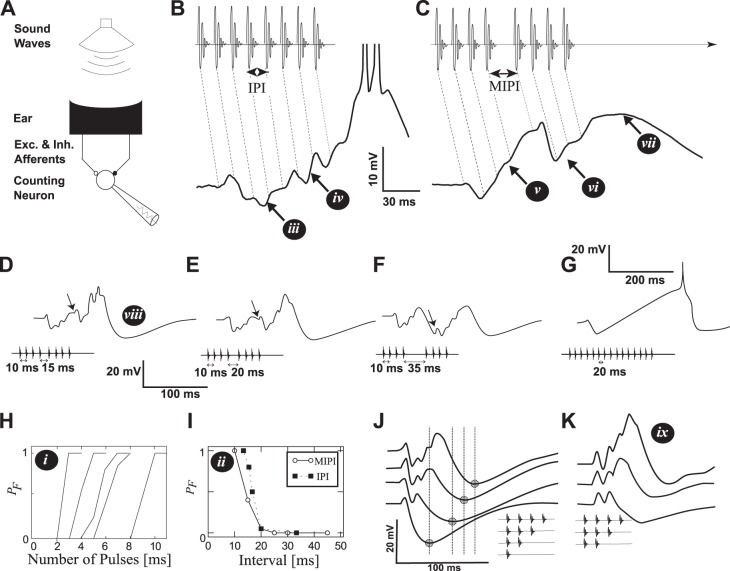
Fig. 1.
Interval-counting neurons in anurans. The white roman numerals in black circles point to a set of 9 main features described in methods. A: a series of sound pulses are produced by a loudspeaker while recording from a cell in the midbrain. B: a pulse sequence made of 8 regular intervals (IPI = 13 ms, top) and the membrane potential response (bottom). The dotted diagonal lines indicate the correspondence between sound pulses and their associated postsynaptic potentials. C: a pulse-sequence interrupted by a longer middle interval MIPI = 25 ms. D–F: recorded membrane potential in response to calls interrupted by increasingly long intervals. G: recorded membrane potential for a cell with a high count threshold. H: the probability PF of observing a response to a periodic train of pulses as a function of the number of pulses in a call. Each curve corresponds to a different cell. I: dependence of PF on the baseline IPI (filled squares). Roughly the same dependence is found by increasing only the MIPI (abscissa value) but keeping the baseline IPI fixed to 10 ms (empty circles), when the number of pulses that preceded and followed the MIPI was one less than the count threshold. J: responses to sequences made of 1–4 sound pulses. The minimum membrane potential is marked with a circle and a vertical line. K: responses to sequences made of 2–4 sound pulses when the same cell was hyperpolarized by 12 mV. Same scale as in subplot J. Data from Alder and Rose (1998), Edwards et al. (2002, 2007), and Rose et al. (2011).

