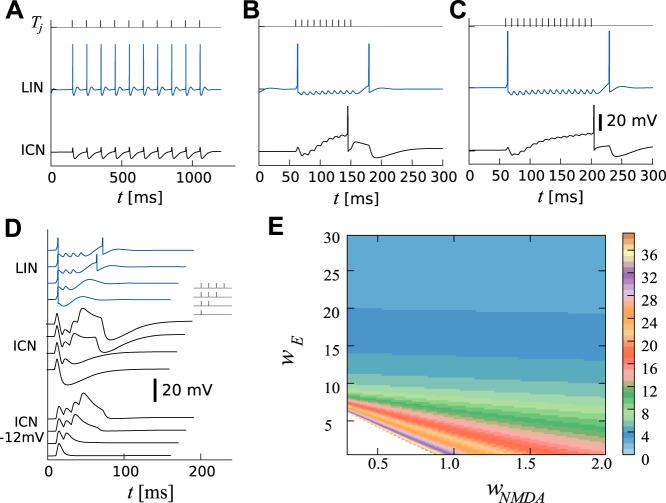
Fig. 3.
Simulated responses of LIN and ICN to uninterrupted calls. A: response to a pulse sequence with long IPIs (top black ticks, IPI = 100 ms) in the ICN (black line) and LIN (blue). B: same as A but for short IPIs (IPI = 10 ms). Note that the rebound spike in LIN causes offset-inhibition in ICN. C: weaker excitatory synapses onto ICN increase the count threshold. D: simulated responses to 1- to 4-pulse stimuli are stacked vertically. Responses of LIN (blue traces) show a rebound for more than two pulses. Responses of ICN when hyperpolarized by 12 mV show an apparent increase in EPSP amplitude (black traces, middle). Responses of ICN (black traces, bottom) reach their minimum with increasing delay as the number of pulses is increased. E: count thresholds between 1 and 40 are shown (colormap on the right) as a function of the excitatory synaptic weights wE and wNMDA. The steplike appearance of the boundaries in parameter space is due to the discrete nature of the count thresholds. Simulations were performed with IPI = 10 ms. Parameters are shown in Table 1, except for C, which used a smaller synaptic weight wE = 5 to increase the count threshold to 15.

