
Fig. 6.
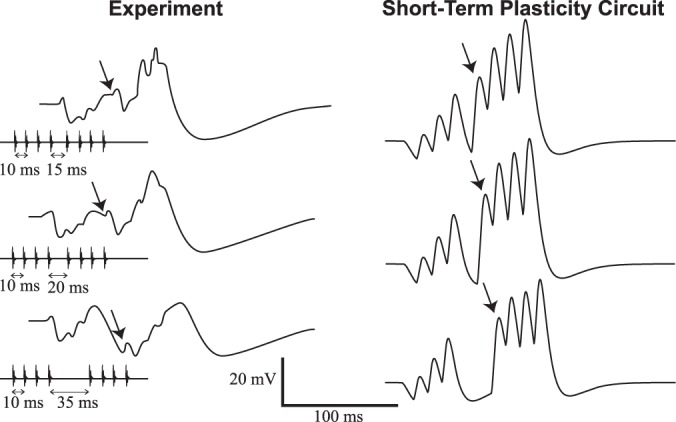
Simulations of STP model (Fig. 2B) compared with experimental recordings. Left column shows membrane potential recordings of ICNs (as in Fig. 1). Right column shows simulations of model depicted in Fig. 2B with short-term facilitation of excitation and pulse-per-pulse inhibition. Calls with IPI = 10 ms are interrupted by MIPI = 15 ms (top), 20 ms (middle), and 35 ms (bottom). The arrows indicate the EPSP associated with the fifth sound pulse. Model parameters are shown in Table 1.