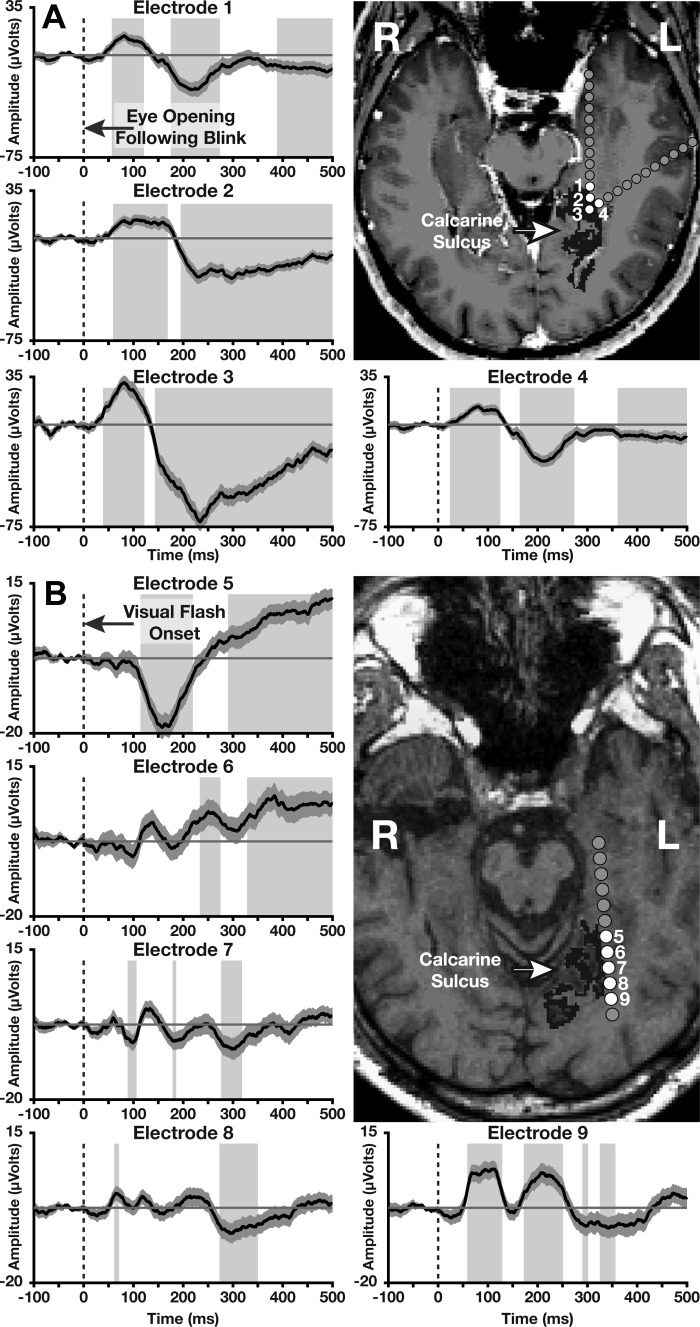
Fig. 3.
ECoG-ERPs evoked by full-field luminance changes at blink offsets in patient 1 (A) or by centrally flashed visual images in patient 2 (B) recorded from depth electrodes (white circles) along the calcarine sulcus (dark gray regions). As seen in A, full-field luminance changes evoked strong activity from all 4 anterior calcarine electrodes. As seen in B, central flashes evoked activity only from posterior calcarine electrodes that map to central visual locations, with significant activity obtained from the most posterior electrode. Shaded regions represent means ± SE. Gray boxes highlight statistically significant intervals based on P < 0.05 across 10 or more contiguous time points (see main text for a more conservative analysis).

