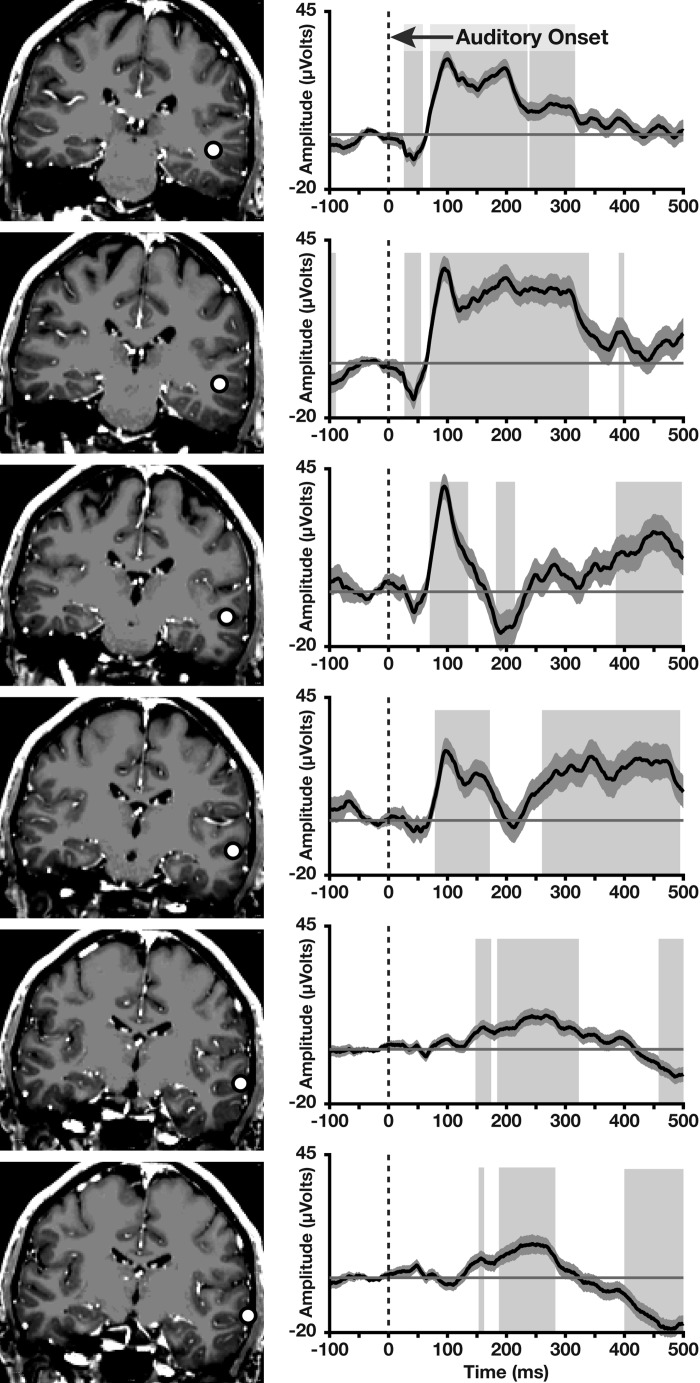
Fig. 4.
ECoG-ERPs evoked by sounds at depth electrodes (white circles) in auditory areas in patient 1 (averaged for sounds presented contralateral and ipsilateral to the electrodes). ECoG-ERPs show a short latency negative deflection followed by a positive deflection at 100 ms. Shaded regions represent means ± SE. Gray boxes highlight statistically significant intervals based on P < 0.05 across 10 or more contiguous time points (see main text for a more conservative analysis).

