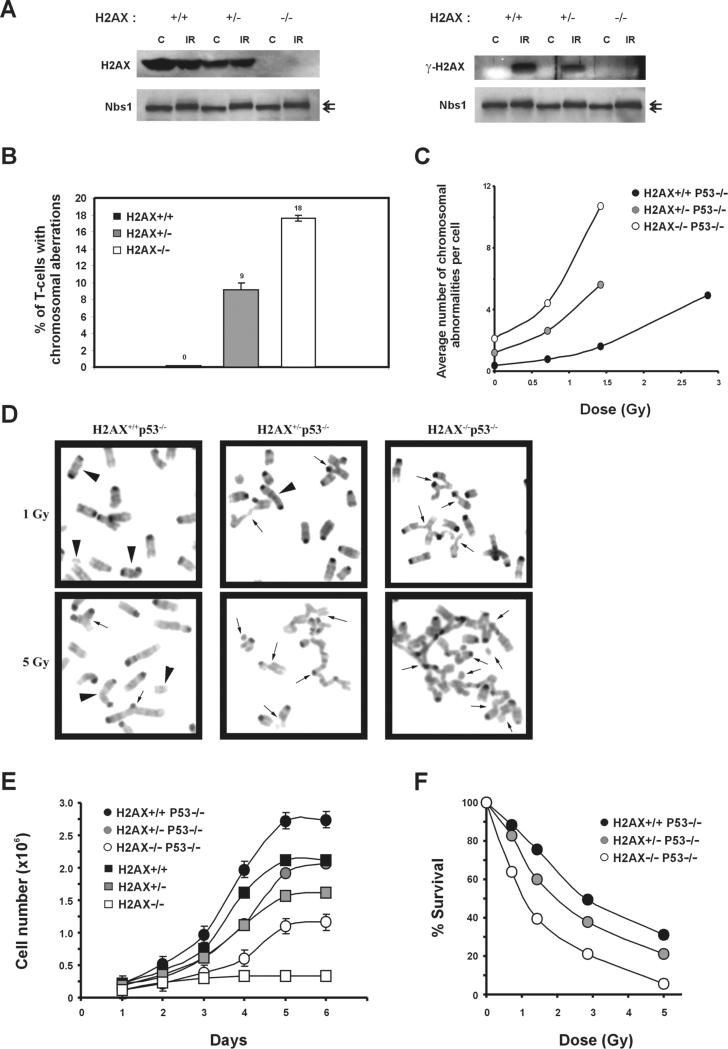
Figure 5. Loss of One Copy of H2AX Leads to Genomic Instability.
(A) Western blot analysis of H2AX (left) and γ-H2AX (right) protein in H2AX+/+, H2AX+/−, and H2AX−/− thymocytes before (C) and 30 min after treatment with 10 Gy γ-irradiation (IR). Nbs1 protein levels are shown below as loading controls. The position of phosphorylated Nbs1 relative to the unphosphorylated form is noted with arrows (upper and lower, respectively).
(B) Lymph node T cells from H2AX+/+, H2AX+/−, and H2AX−/− littermates were cultured for 2 days, and metaphase spreads were examined for chromosomal aberrations. A total of 100 metaphases from two mice of each genotype were scored.
(C) Passage 1 MEFs were either untreated or irradiated with graded doses of γ-irradiation, and metaphases were prepared 16 hr later. Average number of chromosome aberrations (breaks, fragments, and exchanges) is plotted. For each dose, at least 30 metaphases were examined for each genotype.
(D) Examples of metaphases from H2AX+/+p53−/−, H2AX+/−p53−/−, and H2AX−/−p53−/− passage 1 MEFs after treatment with 1 Gy (top) and 5 Gy (lower panels) γ-irradiation. Arrowheads, chromosome type aberrations; arrows, chromatid type aberrations.
(E) Growth kinetics of H2AX+/+, H2AX+/−, H2AX−/−, H2AX+/+p53−/−, H2AX+/−p53−/−, and H2AX−/−p53−/− MEFs at passage 1. The cell number is an average of duplicates from two independent cells lines of each genotype. The slopes (number of cells per day), calculated from early time points in curves, were: H2AX+/+, 8.67 × 10⁵; H2AX+/−, 4.88 × 10⁵; H2AX−/−, 3.10 × 10⁴; H2AX+/+p53−/−, 9.98 × 10⁵; H2AX+/−p53−/−, 5.11 × 10⁵; and H2AX−/−p53−/−, 2.22 × 10⁵.
(F) Radiation sensitivity of H2AX+/+p53−/−, H2AX+/−p53−/−, and H2AX−/−p53−/− passage 1 MEFs, plotted as a fraction of surviving cells relative to unirradiated samples of the same genotype. Data were obtained from an average of duplicates from two independent cell lines.

