
Fig. 2. Emotional contagion.
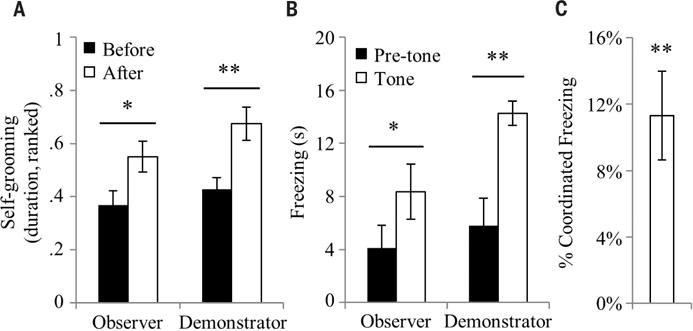
Prairie vole observers exposed to a stressed demonstrator show anxiety-and fear-related responses that match the demonstrator’s responses. (A) Anxiety-related behavior was measured in observers and demonstrators (n = 24 pairs) interacting after reunion. Bars represent the mean ± SEM of the ranked duration of self-grooming performed by the observer and demonstrator. (B) Freezing was measured while fear-conditioned demonstrators and unconditioned observers (n = 12 pairs) were exposed together to a 30-s conditioned stimulus (CS). Bars represent the mean ± SEM of freezing before and after the CS. (C) Coordinated freezing during the CS between observer and demonstrator pairs (n = 12 pairs), calculated as the within-pair difference between the observed percent of simultaneous freezing and the simultaneous freezing expected by chance. *P < 0.05, **P < 0.005.