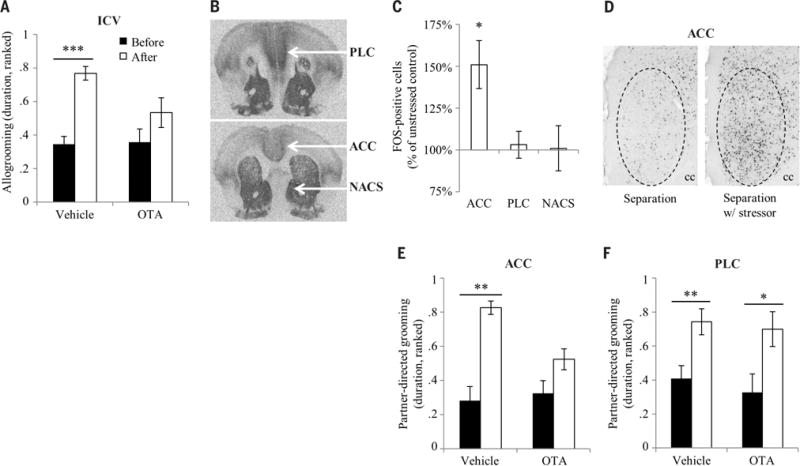
Fig. 4. Neural mechanisms of consolation behavior.

(A) Observers received an intracerebroventricular (ICV) injection of OTA (n = 16 voles) or vehicle (n = 12 voles) before the consolation test. Bars represent mean ± SEM. (B) Receptor autoradiographs show the presence of OTR in prairie vole PLC, ACC, and NACS. (C) Observers were administered a consolation test with control separations (n = 10 voles) or separations with stressor (n = 9 voles). Bars represent mean ± SEM. (D) Images show FOS immunoreactivity in the right ACC of observers representing the mean from each treatment group. Dashed circles show the quantified area. cc, corpus callosum. (E) Observers received a bilateral injection of OTA (n = 8 voles) or vehicle (n = 7 voles) directly into the ACC before the consolation test. Bars represent mean ± SEM. (F) Observers received a bilateral injection of OTA (n = 8 voles) or vehicle (n = 9 voles) directly into the PLC before the consolation test. Bars represent mean ± SEM. *P < 0.05, **P < 0.005, ***P < 0.0005.
