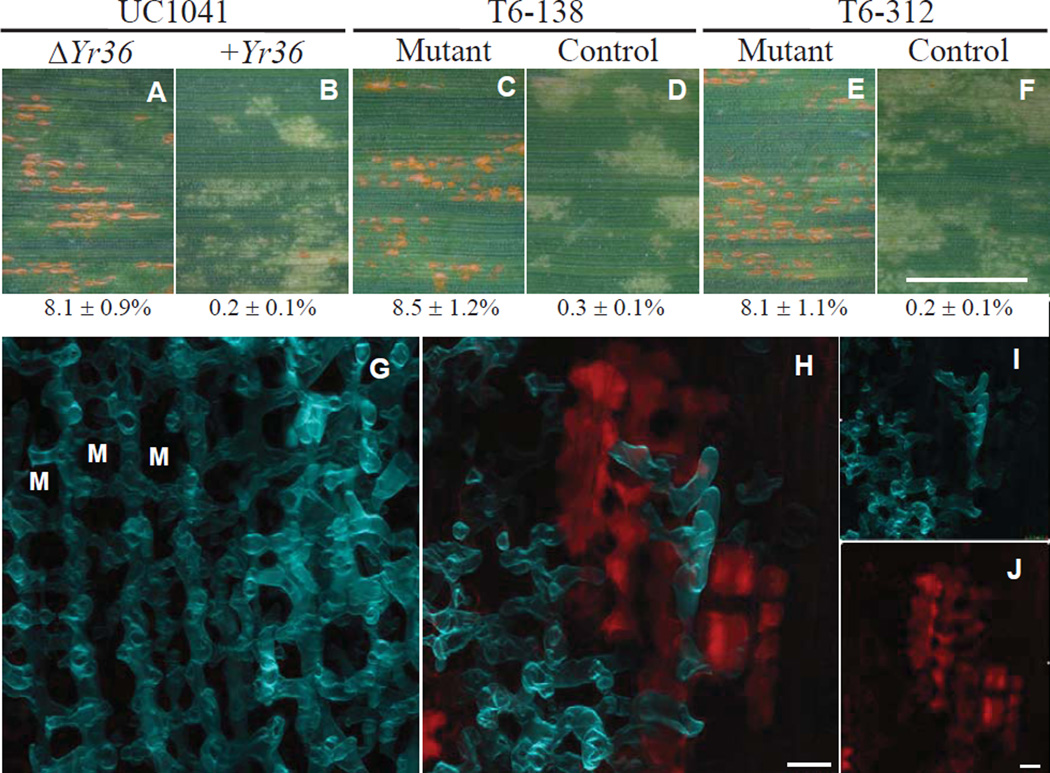
Fig. 2. Functional validation of Yr36 by mutational analysis.
(A to F) Leaf surfaces 11 days after PST inoculation. Bar = 5 mm. Numbers below leaves are average percent leaf area with pustules ± SEM (N=8, fig. S2). An ANOVA of the log-transformed data showed significant differences (P<0.01) between mutant and control lines. (A) UC1041 without Yr36. (B) UC1041+Yr36 isogenic line used for mutagenesis. (C and E) Lines T6-138 and T6-312 with homozygous mutations in the WKS1 kinase domain. (D and F) Sister lines without the mutations. These and additional mutant lines are described in table S7, and figs. S6 to S9. (G and H) A dual-channel, confocal microscopic z-series inside a wheat leaf 13 days after PST inoculation. Bar = 20 µm. The uvitex-stained fungus (false-color blue) and autofluorescing wheat leaf cells (false color red) are visible. (G) The susceptible T6-312 mutant has an extensive mycelial network in which each (invisible) plant mesophyll cell (selected cells shown as M) is encircled by a hypha. (H) The T6-312 control line has a poorly developed fungal network surrounded by autofluorescent mesophyll cells that presumably were involved in the resistance response. (I and J) Separate channels of panel (H).

