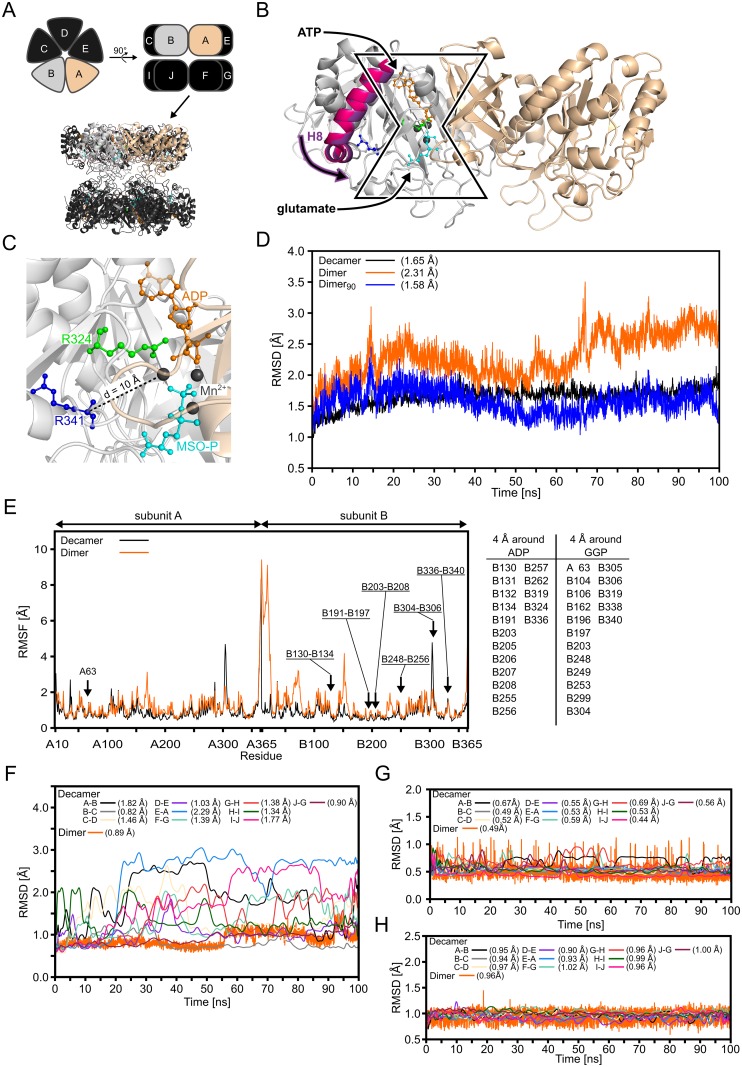
Fig 1. Structure of human GS, the dimeric model system, and the binding site in the crystal structure and during MD simulations.
(A): Schematic representation of the GS decamer in top (top, left) and side (top, right) view. Subunits are labelled A to J. Below, the crystal structure of GS (PDB entry 2QC8 [22]) is shown in cartoon representation. Subunits A (beige) and B (grey) used for the dimeric model system are highlighted, as in the schematic representation. (B): Close-up view of the dimeric model system. Subunits A (beige) and B (grey) extracted from the GS decamer are shown in cartoon representation. ADP (orange) and the GS inhibitor L-methionine-S-sulfoximine phosphate (MSO-P, cyan) are depicted in ball-and-stick representation bound to the bifunnel-shaped catalytic site in the interface between two subunits; manganese ions (Mn2+) ions are shown as black spheres. ATP binding promotes a shift of helix 8 (H8; magenta from PDB entry 2UU7 of canine GS in the apo form [22]; violet from PDB entry 2QC8 of human GS bound to ATP and MSO-P [22]) that enables glutamate binding. (C): Close-up view of the binding site of GS in the crystal structure with ADP (orange), MSO-P (cyan), and both mutated residues [17, 18] R324 (green) and R341 (blue) in ball-and-stick representation. Mn2+ ions are shown as black spheres. Residue R341 is separated by ~ 10 Å from the center of the binding site (dashed line). (D): Backbone RMSD relative to the starting structure during 100 ns of MD simulations of the GS decamer (Decamer) and the dimeric model including all residues (Dimer) or only residues of the core region (Dimer90); the GSADP+GGP state was simulated. The core region comprises 90% of the residues with the lowest RMSF. Respective mean RMSD values are listed in brackets; SEM < 0.1 Å in all cases. (E): Residue wise RMSF for subunits A and B in the GS decamer and the dimeric model system during 100 ns of MD simulations of the GSADP+GGP state. The table lists residues that are separated by ≤ 4 Å from ADP or GGP; regions encompassing such residues are highlighted with an arrow and labeled in the figure. (F): Backbone RMSD of residues listed in the table in panel E relative to the starting structure during 100 ns of MD simulations for ten dimeric pairs in the GS decamer and the dimeric model. For the decamer, the backbone RMSD was plotted as smoothed cubic spline. Respective mean RMSD values are listed in brackets; SEM < 0.1 Å in all cases. (G): RMSD of ADP relative to the starting structure after superimpositioning of the protein atoms during 100 ns of MD simulations for ten dimeric pairs in the GS decamer and the dimeric model. For the decamer the RMSD was plotted as smoothed cubic spline. Respective mean RMSD values are listed in brackets; SEM < 0.1 Å in all cases. (H): RMSD of GGP relative to the starting structure after superimpositioning of the protein atoms during 100 ns of MD simulations for ten dimeric pairs in the GS decamer and the dimeric model. For the decamer the RMSD was plotted as smoothed cubic spline. Respective mean RMSD values are listed in brackets; SEM < 0.1 Å in all cases.

