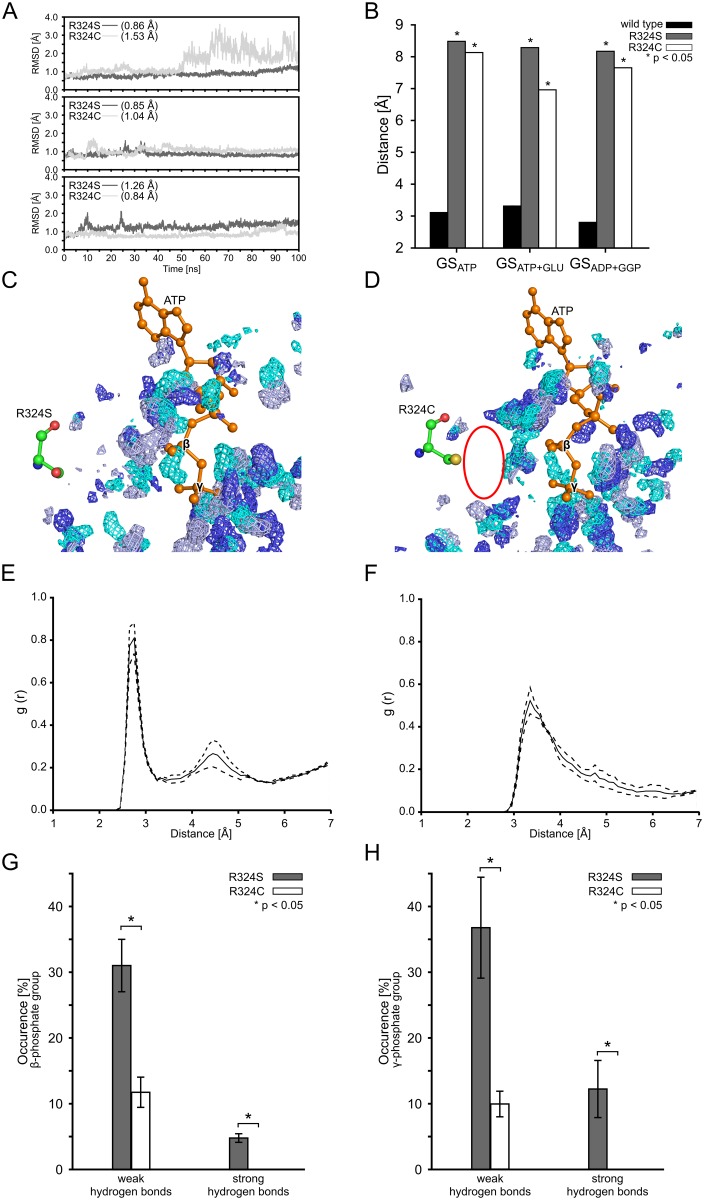
Fig 2. Structural changes and water structure in the binding sites of the R324S and R324C mutants.
(A): Backbone RMSD of catalytic site residues (for definition see Fig 1E) of the R324S (dark grey) and R324C (light grey) mutants in the GSAPO state during 100 ns of MD simulations (each subpanel shows MD simulations initiated from a different starting structure (see section “Experimental procedures” above)). Respective mean RMSD values are listed in brackets; SEM < 0.1 Å in all cases. (B): Mean distances between R324 (wild type GS), or S324 and C324 in GS mutants, and the β-phosphate group of ATP in states GSATP and GSATP+GLU or ADP in state GSADP+GGP, respectively. Stars indicate significant differences (p < 0.05) with respect to the wild type. In all cases, SEM < 0.1 Å. (C, D): Density distribution of water around ATP in the binding site during MD simulations of R324S (C) and R324C (D) in the GSATP+GLU state. Regions where water is most present are indicated by water density grids for three MD simulations (cyan, light blue, and dark blue; isopleths were plotted such that they encompass 80% of the maximum occupancy). ATP (orange) and the mutated amino acid 324 are shown in ball-and-stick representation. The red oval indicates an area of pronounced difference in the water density between the R324S and R342C mutants. (E, F): Radial distribution function (RDF) of water oxygens around the side chain oxygen or sulfur, respectively, of S324 (E) and C324 (F) in the GSATP+GLU state. The solid line shows the mean RDF, and dashed lines indicate ± SEM. (G, H): Mean relative occurrence of water-mediated hydrogen bonds between the β-phosphate group (G) or the γ-phosphate group (H) of ATP and residues S324 (gray) or C324 (white), respectively, in the GSATP+GLU state. The distance cutoff for the hydrogen bonds was set to 2.8 Å for strong hydrogen bonds and 3.2 Å for weak hydrogen bonds. Error bars denote the SEM; stars indicate a significant difference (p < 0.05) between both mutants. For panels B—H, data from the 20–100 ns intervals of the respective MD simulations was taken.

