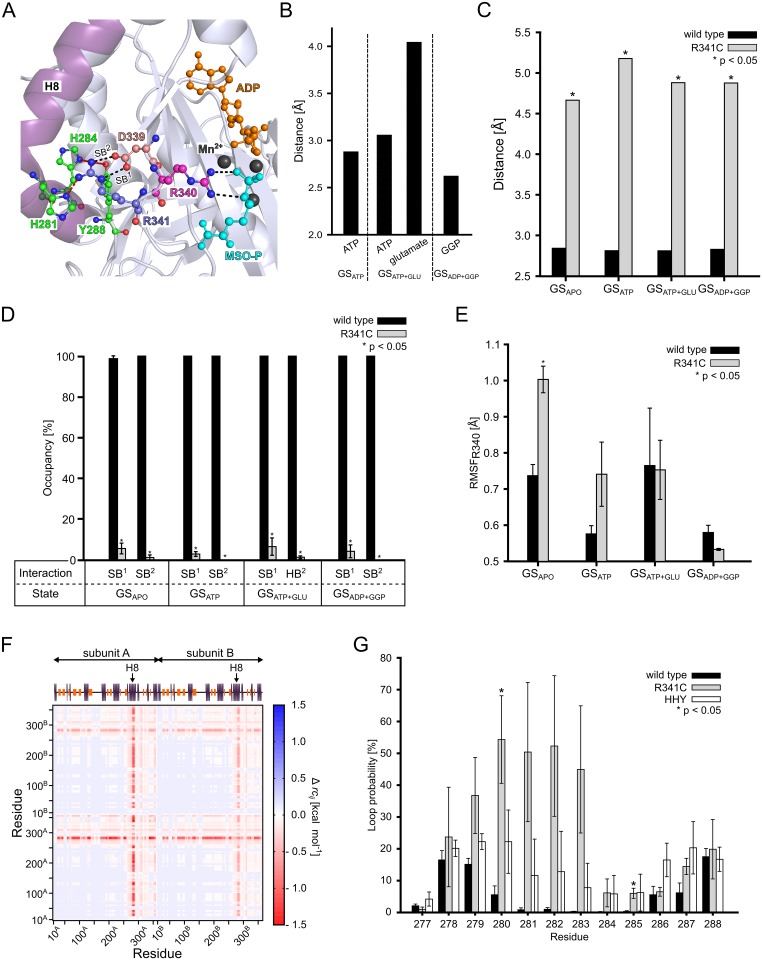
Fig 3. Structural and stability changes in the R341C mutant.
(A): Close-up view of the crystal structure of human GS (PDB entry 2QC8 [22]) around R341. The triad composed of residues D339, R340, and R341, and residues H281, H284, and Y288 on helix 8 (H8; raspberry) are shown in ball-and-stick representation. The salt bridge between D339 and R341 (SB1 and SB2)) and the interaction between R340 and L-methionine-S-sulfoximine phosphate (MSO-P) are indicated by black dashed lines. Interactions between R341 and H281, H284, and Y288, respectively, are indicated by red dashed lines. ADP (orange) and MSO-P (cyan) are depicted in ball-and-stick representation, and Mn2+ ions are shown as black spheres. (B): Mean distances between terminal guanidino nitrogens in R340 and the oxygens of the γ-phosphate group of ATP oriented towards R340, the center of oxygens of the γ-carboxylic group of glutamate, and the carbonylic oxygen in GGP. SEM < 0.1 Å in all cases. GSATP, GSATP+GLU, and GSADP+GGP were considered. (C): Mean distances of interactions SB1 and SB2 (see panel A) for wild type GS and when considering the thiol group of C341 in the R341C mutant. SEM < 0.1 Å in all cases. Stars indicate a significant difference (p < 0.05) between wild type and mutant. (D): Mean occupancy of interactions SB1 and SB2 (see panel A) for wild type GS and when considering the thiol group of C341 in the R341C mutant. Error bars denote the SEM; stars indicate a significant difference (p < 0.05) between wild type and mutant. (E): All-atom RMSF of residue R340 in wild type GS and the R341C mutant. Error bars denote the SEM; stars indicate a significant difference (p < 0.05) between wild type and mutant. (F): Stability map depicting significant differences (p < 0.05) in the structural stability as computed by CNA between wild type GS and the R341A mutant. Protein structures were extracted from the GSADP+GGP state: Blue colors indicate that two residues are less stably connected in wild type, red colors that two residues are less stably connected in the R341A mutant. The secondary structure of GS is depicted on the top, with orange bars representing β-strands and blue bars representing α-helices; H8 is labelled. Subunits are indicated by arrows. (G): Probability for residues 277 to 288 of H8 to be in a loop conformation during MD simulations of wild type GS, the R341C mutant, and the HHY mutant in the GSATP state. Error bars denote the SEM; stars indicate significant differences (p < 0.05) with respect to the wild type. Results in panels B-G are based on snapshots recorded during the 20–100 ns interval of the respective MD simulations.

