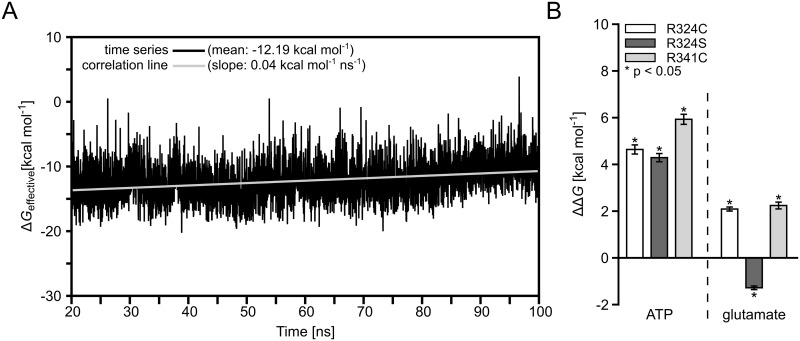
Fig 6. Mean relative effective binding energies of ATP or glutamate.
(A): Time-series of effective binding energies calculated for 4000 snapshots extracted in 20 ps intervals from the last 80 ns of MD simulations of glutamate bound to wild type GS in the GSATP+GLU state (black line) and least-squares line of best fit from a correlation analysis (grey line). The mean of the effective binding energies and the slope of the least-squares line of best fit are given in the legend. (B): Mean effective binding energies with respect to wild type GS (ΔΔG, eq 1). ΔΔG values were calculated by the MM-PBSA approach for ATP in the GSATP state and for glutamate in the GSATP+GLU state for GS mutants R324C, R324S, and R341C. Error bars indicate SEM total (eq 3); stars indicate a significant difference (p < 0.05) between wild type and mutant.

