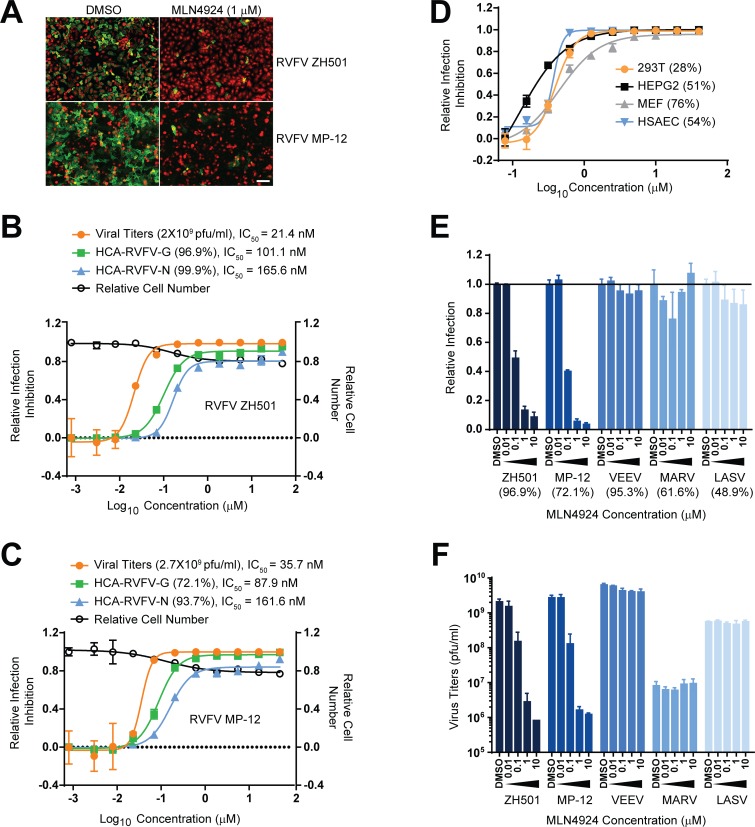
Fig 1. MLN4924 inhibits RVFV infection.
(A) IFA of RVFV N or G expression (green) in HeLa cells (cytoplasm in red) that were infected with ZH501 (MOI = 1, 24h) or MP-12 (MOI = 1, 24h) and were either treated with control DMSO (0.5%) or MLN4924 (1 μM) from 1h prior to start of infection to the end of the infection. (B-C) Dose response curve analyses of MLN4924’s antiviral activity against ZH501 (B) and MP-12 (C) virus infection in HeLa cells. Virus infections were measured by HCA of G or N expressing cells or by plaque assay. The values in the brackets next to the name of the dose response curve indicates the average infection in mock (DMSO) treated cells. The infection rates of MLN4924 treated cells were normalized with the corresponding values derived from DMSO treated controls, which were considered as 100% and expressed as the mean ± SD. The final values were expressed as the mean ± SD. (D) Dose response curve analyses of the MLN4924’s antiviral activity against RVFV ZH501 in different cell lines. Infections were measured by HCA of N expressing cells. The values in the brackets next to the names of each cell line, indicate the average infection rate of virus infected cells that were mock (DMSO) treated. Data were normalized as in B-C (E-F) MLN4924 activity against different viruses: VEEV (MOI = 0.1, 24h), MARV (MOI = 3, 48h) and LASV (MOI = 1, 48h) when compared to RVFV ZH501 and RVFV MP-12 infections in HeLa cells. The virus infections were measured by HCA of viral antigen expressing cells (E) or by plaque assay (F): the relative infection in E was calculated by normalizing infection rates of compound treated cells with mock treated cells. The values in the brackets below the virus names indicate the average infection rate in mock (DMSO) treated cells.

