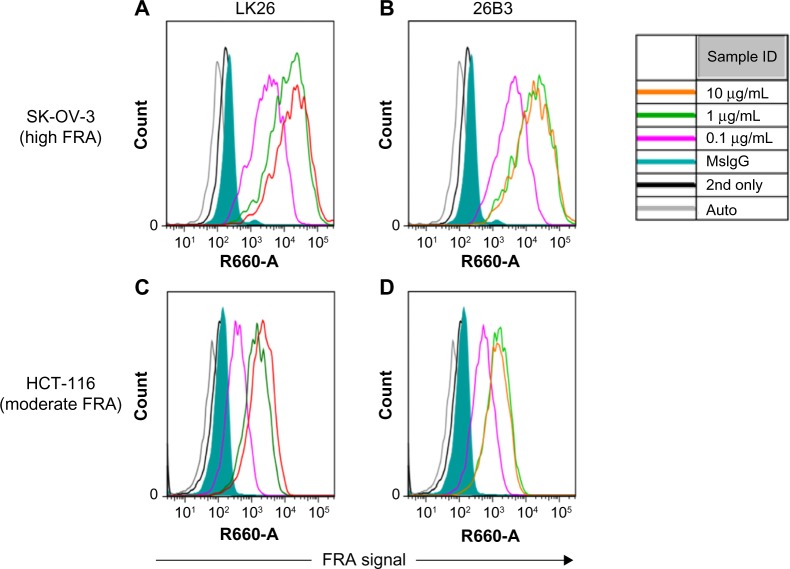
Figure 1.
Flow cytometry of FRα-stained cells: histograms of flow cytometric analysis of SK-OV-3 cells (A and B) and HCT-116 cells (C and D) stained by anti-FRα antibodies LK26 (A and C) and 26B3 (B and D) where the antibodies were diluted to 0.1 μg/mL (magenta), 1 μg/mL (green), and 10 μg/mL (orange). Controls included autofluorescence (gray), Dylight-649-conjugated anti-mouse secondary antibody only (black line) and mouse IgG plus secondary antibody (green shading).

