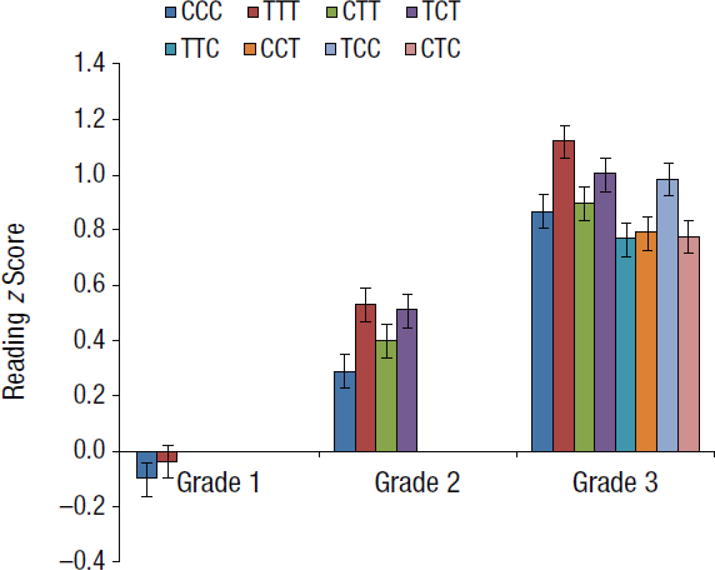
Fig. 5.

Fitted end of first-, second-, and third-grade reading outcomes as a function of whether students (N = 882) participated in Individualizing Student Instruction (ISI)-reading instruction or the mathematics intervention. In the key, “C” indicates the mathematics control group and “T” indicates the ISI-reading treatment condition, with the order of letters signaling which type of instruction was received in Grades 1, 2, and 3 (e.g., TTC students received ISI reading in first and second grade and were in the control group in third grade). Error bars show standard errors. Values were calculated using data shown in Table 7.
