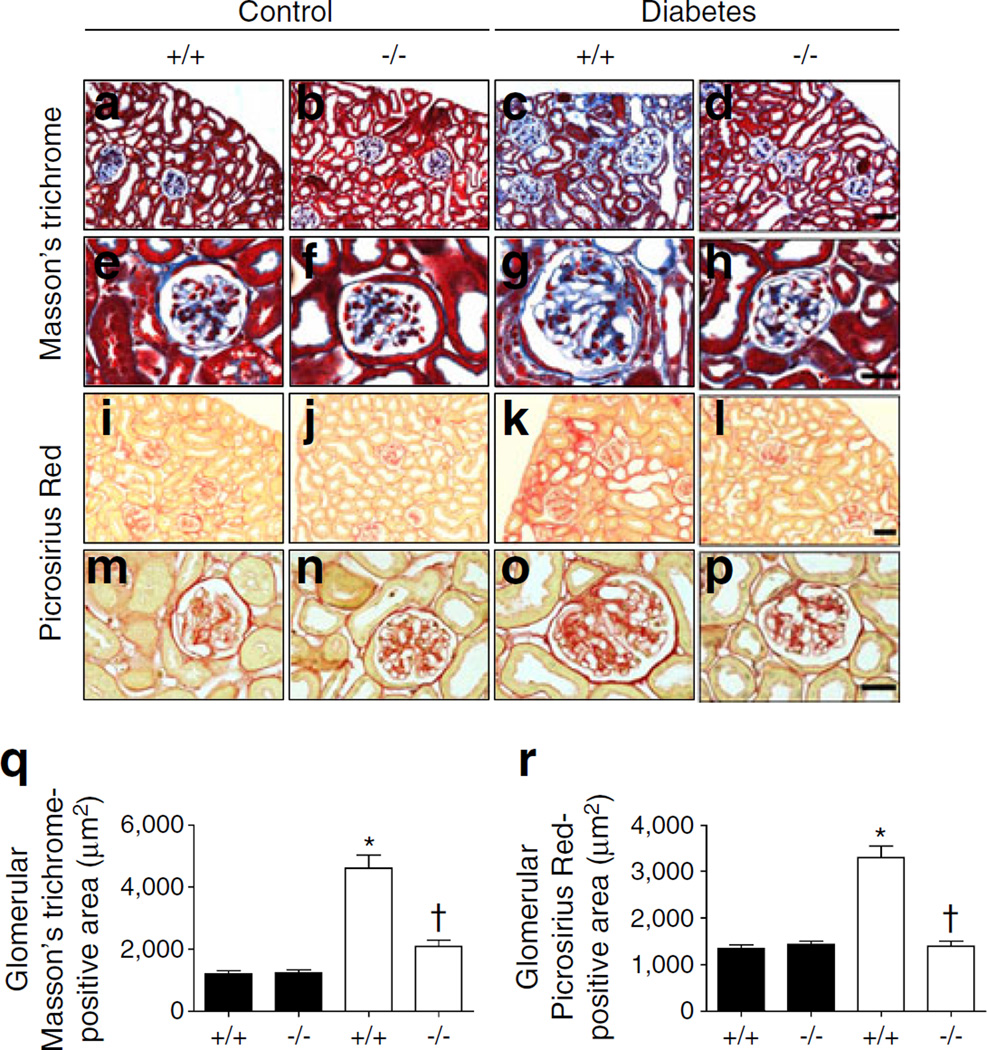
Fig. 2.
Renal fibrosis was reduced in diabetic Cx3cr1 KO mice. Kidney tissue sections from each mouse were stained with Masson’s trichrome (a–d, scale bar, 50 µm; e–h, scale bar, 20 µm) and Picrosirius Red (i–l, scale bar, 50 µm; m–p, scale bar, 20 µm) and quantified using Image J software (20 images per animal) (q–r). Data are mean±SE or representative stained images of 8–12 mice. *p<0.05 vs control Cx3cr1 WT mice; †p<0.05 vs diabetic WT mice. Black bars, control; white bars, diabetes. +/+, WT; −/−, Cx3cr1 KO

